AI Spend Analysis for Cost Avoidance: Guide
Use AI on 12+ months of unified spend data to stop off-contract buys, catch price variance, retire low-use SKUs, and reduce supplier risk.
In this article
If you want to stop avoidable procurement spend, I’d focus on four things first: price variance, maverick spend, low-use SKUs, and supplier concentration. That is where AI can help before extra cost turns into a paid invoice.
Here’s the short version: I’d use at least 12 months of spend data from ERP, AP, P-card, contracts, and direct payments, clean it, normalize supplier and item records, and then track a small set of metrics that show where spend is drifting. The goal is simple: stop off-contract buys, catch overpayment, reduce catalog clutter, and avoid single-supplier exposure.
If I had to boil the article down into one checklist, it would be this:
Define cost avoidance clearly so finance agrees on what counts
Combine all spend sources into one dataset
Track four main signals:
Price variance / PPV
Maverick spend
Low-use SKUs
Supplier concentration risk
Set rules and owners for each alert
Keep an audit trail for every action
A few points stand out:
P-card and direct payment data often hide the most off-policy spend
Free-text descriptions make item matching harder unless turned into structured attributes
Single-source risk can look fine on spend reports until supply problems force a bad buy
A dashboard without a named owner usually turns into a report no one acts on
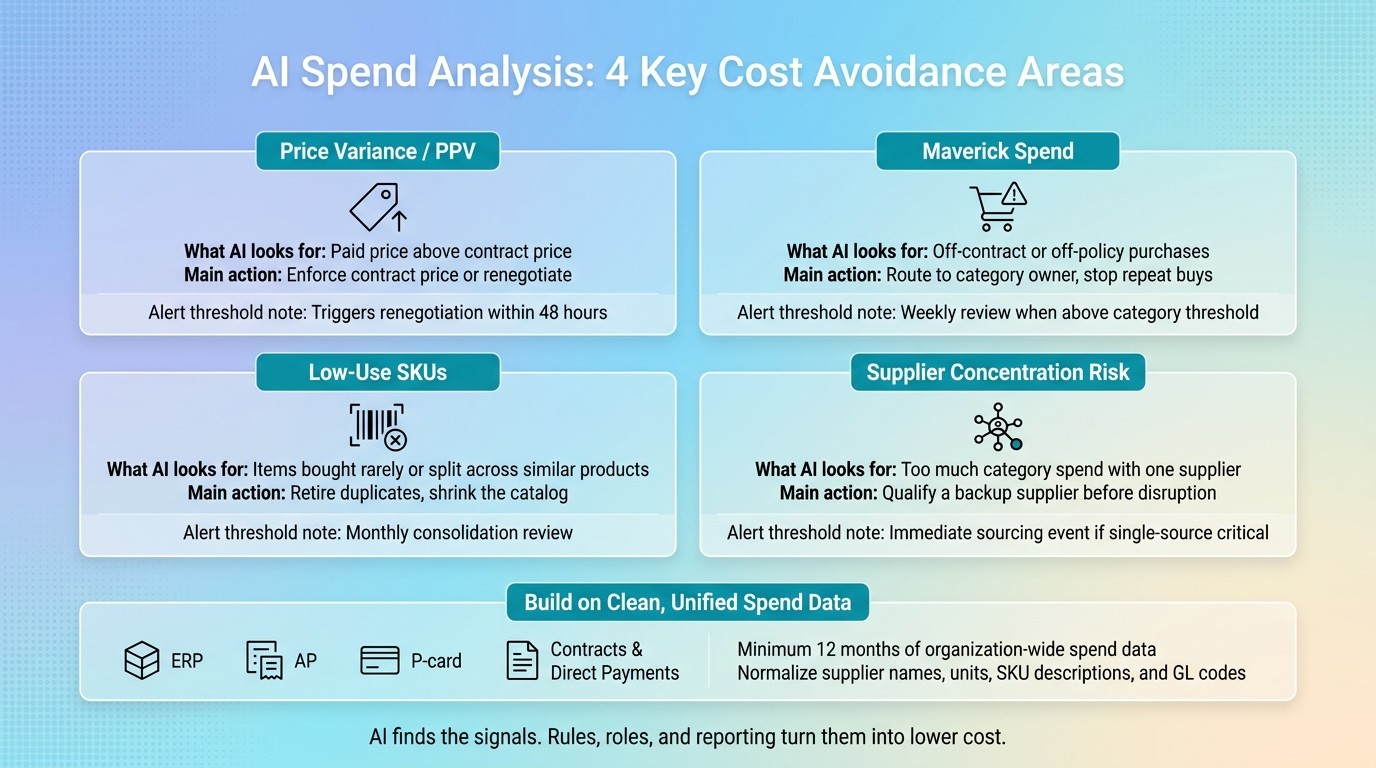
AI Spend Analysis: 4 Key Cost Avoidance Areas at a Glance
Build a Reusable Spend Cube Agent - From Raw GL Data to Instant Spend Analysis | Spendflo
Quick comparison
Area | What AI looks for | Main action |
|---|---|---|
Price variance | Paid price above contract price | Enforce contract price or renegotiate |
Maverick spend | Off-contract or off-policy purchases | Route to category owner and stop repeat buys |
Low-use SKUs | Items bought rarely or split across similar products | Retire duplicates and shrink the catalog |
Supplier concentration | Too much category spend with one supplier | Add another source before disruption hits |
What I like about this approach is that it keeps the scope tight. Instead of trying to fix every spend issue at once, it ties AI analysis to a small set of rules that procurement, finance, and risk teams can review and act on fast.
Build the Data Foundation for Reliable Spend Analysis
Reliable AI spend analysis starts with clean, unified spend data. If the data is messy, split across systems, or full of duplicates, the output won't mean much. In that case, AI isn't spotting patterns. It's just reacting to noise.
That base matters because AI can't consistently flag price variance, maverick spend, low-use SKUs, or supplier concentration risk unless the underlying data is lined up first. Once the dataset is standardized, AI can spot the variance, compliance, SKU, and risk signals covered next.
How to Source and Prepare Spend Data
Pull data from ERP, AP, P-card, contract, and direct payment systems. Each one shows a different part of what the company is buying. If you only use one or two sources, your baseline will have holes.
Use at least 12 months of organization-wide spend data. Shorter timeframes can miss seasonality, contract renewals, and repeat purchases. After you bring the data together, start with supplier normalization. That means merging records like "IBM" and "International Business Machines" into one supplier record so spend doesn't get split across duplicates.
Then clean up the rest:
Remove duplicate records
Normalize supplier names and entities
Fix coding errors
Keep the taxonomy consistent across business units
P-card and direct payment data often hold the most maverick spend, so they need to sit in the same dataset as ERP and AP records.
Normalize Prices, Units, and Product Details for AI Matching
AI needs standard units, currency, and product attributes to compare line items the right way. Consolidation puts the data in one place. Normalization makes the data comparable.
Free-text item descriptions are a big problem here. One team might write a product one way, another team might describe the same item in plain language, and a supplier might use a third version. AI works better when those descriptions are turned into structured technical attributes.
That structure helps AI match equivalent items and check contract compliance. It also makes it easier to spot functional equivalents and contract mismatches, which supports both price variance detection and low-use SKU identification.
The table below shows the main normalization steps and why they matter for AI-driven cost avoidance:
Data Type | Standardization Action | AI Benefit |
|---|---|---|
Supplier Names | Normalize parent/child entities | Detects supplier concentration risk |
Units of Measure | Convert to standard base units | Enables accurate Price Variance (PPV) detection |
SKU Descriptions | Structure into technical attributes | Identifies low-use items and functional equivalents |
GL/category code | Map to consistent taxonomy | Flags maverick spend and off-contract buying |
If the inputs aren't standardized, AI can't compare line items in a dependable way or support cost-avoidance decisions.
With clean inputs in place, the next step is the metrics and dashboards that expose avoidable spend.
Key Metrics and Dashboards That Support Cost Avoidance
Once spend data is normalized, AI can turn purchasing activity into risk signals you can act on: price variance, maverick spend, low-use SKUs, and supplier concentration risk. In plain terms, it helps teams spot where money is slipping away before that spend turns into a bigger problem.
After data is standardized, AI can score exceptions in real time and bring attention to the small set of signals that drive most avoidable cost. That starts with the metrics that expose waste at the line-item level.
Metrics That Measure Avoidable Cost
Metric | Primary Purpose | Data Required | Cost Avoidance Use Case |
|---|---|---|---|
Specification Match Rate | Measures how well a product meets technical requirements at the line-item level | Itemized requirements, supplier documentation | Flags products that miss critical specs before purchase, preventing failed procurement |
Price Variance / PPV | Tracks deviation between contracted and actual purchase price | PO data, contract price files, invoice records | Identifies overpayment and missed contract value across categories |
Maverick Spend Rate | Measures off-contract or off-policy purchases as a share of total spend | PO, P-card, and AP transaction data | Quantifies non-compliant buying and targets categories for policy enforcement |
Low-Use SKU Rate | Tracks the share of catalog items with minimal purchase frequency | SKU-level transaction history | Identifies candidates for catalog rationalization and consolidation |
Supplier Concentration % | Measures spend share held by a single supplier within a category | Supplier-level spend by category | Flags single-source exposure and categories with limited competitive alternatives |
Use requirement-level scoring to show exactly where a product misses critical specs. That matters because a line item can look fine at a glance while still failing one or two requirements that lead to rework, delays, or a bad buy.
Dashboards for Variance, Compliance, SKU Use, and Supplier Risk
Price Variance and Contract Compliance dashboards compare actual purchase prices with contracted rates and flag line items where buyers paid above the contract price. Each exception links back to the source PO and contract record, so category managers can go straight to the problem instead of digging through files.
Maverick Spend and Catalog Usage dashboards surface off-contract transactions by category, supplier, and business unit. They show which teams are buying outside approved channels and what that off-policy spend costs compared with contracted options.
Low-Use SKU and Product Rationalization dashboards flag items purchased fewer than a set number of times during a defined period. They help teams spot cases where several low-use SKUs do the same job and can be replaced with one approved item. It’s a simple way to cut catalog clutter.
Supplier Concentration Risk dashboards show spend share by supplier within each category and flag categories where one supplier sits above a defined threshold. That makes single-source exposure visible before a supply issue forces an unplanned move.
These dashboards work best when they don’t just report the problem. They should feed action on price variance, maverick spend, low-use SKUs, and supplier concentration risk.
How AI Targets the Four Highest-Value Cost Avoidance Areas
Each alert should lead to one clear move: enforce price, stop off-policy buying, trim SKU sprawl, or lower supplier exposure. The sections below show what to do with each signal.
Price Variance and PPV: Find Overpayment and Missed Contract Value
PPV is the gap between the contracted price and the price you actually paid. AI can flag that gap by supplier, contract, pack size, and unit.
That gives procurement teams a direct next step. Enforce contract pricing, renegotiate, or move the buy to another supplier. If the spec is too loose, tighten it before the next purchase. Scoring products against stated requirements, with cited evidence from datasheets or manuals, helps confirm that the paid price lines up with the product being bought. Enforce pricing.
Maverick Spend and Low-Use SKUs: Cut Off-Policy Buying and Catalog Complexity
Maverick spend happens when buyers go outside approved channels, like buying from an off-contract supplier or skipping the catalog. AI can spot off-contract and off-catalog purchases in PO, invoice, and card data. Send those exceptions to category owners and stop repeat off-policy buys.
Low-use SKUs cause a different kind of drag. Too many near-identical items make catalogs messy and split spend across products that do the same job. Cluster similar SKUs, find duplicates, and retire items with little usage. That cuts catalog complexity and pushes spend toward approved items. Retire redundant SKUs.
Supplier Concentration Risk: Flag Categories With Single-Source Exposure
When concentration starts to climb, act before a disruption forces a bad purchase.
Single-source dependency can look fine in cost and compliance reports while still leaving a category exposed. Track category spend share and supplier count. Then flag single-source exposure early and qualify a backup supplier before disruption hits. Qualify a backup supplier.
Decision Rules, Governance, and Reporting for Cost Avoidance
Thresholds and Workflow Rules for Taking Action
Once AI flags price variance, maverick spend, SKU sprawl, or concentration risk, governance is what turns an alert into action. An alert by itself doesn’t create cost avoidance. Each one needs a clear rule, one owner, and a set deadline.
Use rules like these to route each alert to the right person fast.
Metric / Alert | Decision Rule / Threshold | Responsible Role | Response Time |
|---|---|---|---|
Price Variance (PPV) | Breach of the category-specific tolerance band triggers renegotiation workflow | Procurement / Finance | Within 48 hours |
Maverick Spend Rate | Off-contract spend above the category threshold triggers weekly review | Procurement Analyst | Weekly review |
Supplier Concentration | Single-source exposure in a critical category triggers an immediate sourcing event | Procurement / Risk Lead | Immediate |
Low-Use SKUs | Usage below the retirement threshold triggers consolidation review | Engineering / Stakeholder | Monthly review |
Supplier Risk Score | Supplier risk score below the defined threshold triggers backup sourcing or financial review | Finance / Risk Officer | 48 hours |
Set each threshold by category, then document the reason behind it so finance can audit the choice later. That part matters. A threshold that makes sense for one category can be way off for another.
Ownership needs to be just as clear:
Engineering or IT owns specifications and compliance
Procurement owns price and sourcing decisions
Finance or risk owns supplier risk decisions
When those lines get fuzzy, alerts tend to sit in dashboards untouched because no one feels on the hook. The fix is simple: assign one named owner to every rule before go-live.
Conclusion: What Procurement Teams Should Measure, Monitor, and Act On
Every cost avoidance result needs to hold up under review from finance, auditors, and leadership. That means each flagged exception should tie back to an audit trail, and each reporting cycle should end with a short summary that people can review fast. A one-page cost-avoidance summary linked to a full decision record is much easier for finance and audit to check.
The main takeaways from this guide come down to four things: clear thresholds tied to each category, dashboards that send alerts to the right owner, governance rules that assign accountability and timing, and audit-ready reporting that keeps the evidence behind each decision. AI finds the signals. The rules, roles, and reporting setup decide whether those signals lead to lower cost.
FAQs
How much spend data do I need to start?
You don't need a set amount of past spend data to start using Procright.
That's because Procright is a pre-purchase intelligence platform. It helps procurement teams at the very start of the buying cycle, when they're still defining needs, building specifications, and figuring out which products are a fit.
Put simply: if you have a procurement need, you can start using Procright right away.
Which spend source reveals the most hidden leakage?
The biggest hidden leakage usually starts at the specification stage, before any vendor is contacted.
When specifications are vague or incomplete, vendors fill in the gaps with their own assumptions. That turns the buying process into an apples-to-oranges comparison. And it can push buyers toward items that don’t match what they actually need.
Procright helps by using AI to spot missing requirements and clear up specifications early.
How should I set alert thresholds by category?
Set alert thresholds by category based on your organization’s risk tolerance and procurement goals. First, classify spend so you have a clear baseline.
Then use automated alerts to flag gaps from those benchmarks or from negotiated contracts. Put the most weight on items that matter most to day-to-day operations. From there, keep a close eye on overspend, contract leakage, and places where you may be able to consolidate purchases.
Related Blog Posts
Try it on a real buy
Bring one category. Watch where the flags land.
We use a little analytics to see which pages actually help. Nothing else, no ad trackers.