Procurement Cycle Time: Metrics to Track
Track requisition-to-delivery and stage timings, use p75/p90 and automation metrics to find bottlenecks and cut P2P cycle time.
In this article
Procurement cycle time measures how long it takes to go from identifying a need to receiving goods or services. Tracking this time is crucial to improve efficiency, reduce costs, and avoid delays. Here's what you need to know:
Definition: Procurement cycle time = Delivery Date - Requisition Date.
Key Stages: Includes requisition, approval, sourcing, PO creation, delivery, and payment.
Why It Matters: Long cycle times increase costs (e.g., expedited shipping) and create inefficiencies.
Metrics to Track:
Average cycle time.
Stage-specific times (e.g., requisition-to-PO, supplier lead time).
Variability (e.g., p75, p90 metrics).
Improvement Tips: Use approval automation, reduce manual steps, and track delays at each stage.
Industry benchmarks show top performers complete requisition-to-PO in under 40 hours, while others take over 90 hours. Tracking the right metrics helps identify bottlenecks and optimize processes.
Breaking Down the Procurement Cycle
Key Stages in the Procurement Process
The procurement cycle takes a purchase from identifying a need to completing the transaction. It starts with needs identification and requisition - a department spots a requirement and submits a formal purchase requisition (PR). This document outlines what’s needed, estimates costs, and specifies timing. From there, the request enters an approval workflow, where finance and department heads confirm that the budget can accommodate the purchase before any commitments are made.
Once approved, the process moves to sourcing and supplier selection. This involves researching vendors, comparing products and vendors, and evaluating options based on factors like price, quality, and reliability. After selecting a vendor, the negotiation and contracting phase finalizes details such as pricing, payment terms (e.g., Net 30 or Net 60), and legal protections. With terms agreed upon, a purchase order (PO) is issued, serving as a legally binding document for both parties throughout the fulfillment process.
The next step is order fulfillment and delivery, where the supplier provides the goods or services, which are then inspected to ensure they match the original PO. Finally, the process concludes with 3-way matching and invoice processing, where finance teams compare the PO, goods receipt, and vendor invoice to ensure accuracy before releasing payment.
Procurement Stage | Primary Action | Finance Control Point |
|---|---|---|
Requisition | Define the business need | Verify budget availability |
Approval | Stakeholder review and authorization | Enforce approval hierarchy |
Sourcing | Vendor research and selection | Financial due diligence |
PO Creation | Issue legally binding order | Reserve budget (encumbrance) |
Delivery/Receipt | Inspect goods or services | Match PO vs. receipt |
3-Way Match | Reconcile PO, receipt, and invoice | Prevent overpayment or fraud |
Payment | Finalize transaction | Segregation of duties |
Breaking down these stages helps identify where delays might occur and how to address them effectively. Implementing a procurement workflow automation checklist can further streamline these stages and reduce manual errors.
Why Tracking Time at Each Stage Matters
Tracking the time spent at each stage of the procurement cycle provides more than just an overview - it pinpoints where bottlenecks happen. By recording timestamps for each handoff, from requisition submission to PO issuance, you can identify exactly where requests are stalling.
This targeted insight is essential for resolving delays. As Michele Kerr highlights:
"The fix depends on the bottleneck. If requests are incomplete, faster approvals will not help. If vendor setup is the delay, better intake forms will not solve it."
Stage-specific tracking also enhances financial visibility. When finance teams can see spending commitments at the requisition stage, rather than waiting until invoices arrive, they avoid surprises. This early insight helps prevent the "invoice surprise" problem - where costs only surface after they’ve already been incurred. With this level of visibility, organizations can maintain tighter budget control and improve forecasting accuracy.
Core Metrics for Measuring Procurement Cycle Time
Average Procurement Cycle Time
A key metric to monitor is average procurement cycle time, which is calculated by measuring the time between the requisition date and the delivery date. This figure provides a snapshot of how efficiently your organization moves from identifying a need to fulfilling it.
However, relying solely on averages can be deceptive. A smooth average might hide a few outliers - transactions that take excessively long and create challenges like strained vendor relationships or disrupted budget planning. To get a clearer view, it’s helpful to also track the p75 and p90 metrics, which represent the slowest 25% and 10% of transactions, respectively. For deeper insights, breaking down cycle times by individual stages is essential.
Stage-Specific Metrics
Digging deeper into the process, stage-specific metrics help identify exactly where delays are happening. For instance, requisition-to-PO cycle time measures the time from when a purchase request is submitted to when a purchase order is approved. Recent trends show a slight increase in this cycle time, likely due to more complex approval processes.
"Most finance and procurement leaders assume PO cycle time is an approval problem. It isn't. ... The difference rarely comes down to how fast approvers click. It comes down to how the process is designed." - Michele Kerr, Procurify
Top-tier organizations complete this step in about 5 hours, while less efficient ones take up to 48 hours. Industry differences also play a role: Healthcare and Financial Services average 43 hours, the Public Sector averages 69 hours, and Technology, Media & Telecom lags at 90 hours.
Other metrics worth tracking include:
Approval turnaround time: Measures how long approvals take.
Sourcing event cycle time: Tracks the time spent selecting a vendor.
Supplier lead time: Measures the days between issuing a PO and receiving goods or services.
Tracking these metrics separately helps distinguish internal bottlenecks, like slow approvals, from external ones, such as vendor delays.
For more accurate insights, it’s wise to measure cycle times for goods and services separately. Service-based purchase orders often move faster since they don’t involve physical delivery or inspections. Combining these metrics can distort the data and mislead decision-makers.
End-to-End Procure-to-Pay Cycle Time
Taking a broader view, the Procure-to-Pay (P2P) cycle time measures the entire process, from requisition submission to final invoice payment. This metric captures inefficiencies that stage-specific metrics might overlook, such as delays during handoffs between procurement and finance.
To measure the full P2P cycle, track key timestamps at every major step: requisition submission, approval, PO issuance, supplier confirmation, goods receipt, and final payment. Be sure to include all spend categories - excluding non-PO spend can obscure systemic bottlenecks.
P2P Metric | What It Measures |
|---|---|
Requisition-to-PO | Internal efficiency of approval and PO issuance |
Supplier Lead Time | Time from PO issuance to goods or services delivery |
Supplier Setup Time | Time required to onboard and register a vendor |
Invoice-to-Payment | Time finance takes to process payments after goods are received |
Shorter P2P cycles bring more than just speed. They improve cash flow visibility, reduce unexpected financial hiccups, and strengthen vendor relationships, which can lead to better terms and faster fulfillment.
Measuring Variability and Finding Bottlenecks
Cycle Time Variance
While averages can give you a sense of overall performance, they often hide the real story. Variance, on the other hand, shines a light on inconsistencies. If cycle times vary drastically from one transaction to another, it’s a clear sign that the process isn’t just slow - it’s unpredictable.
One effective way to spot variability is by comparing cycle times across teams or departments. For example, if one team consistently wraps up requisitions in 2 days while another takes 10, it’s worth investigating why. The gap could stem from differences in approval practices, incomplete intake data, or informal workarounds. Taking a closer look at extreme percentiles, like the 75th or 90th, can also reveal where the biggest pain points lie.
"Measuring only the headline average, missing that the p75 or p90 might be 4x the median - and that is where dissatisfaction lives." - Vishnupriya B, Data Analyst, Databrain
Another factor contributing to variance is the type of transaction. For instance, low-value, routine purchases might share the same queue as complex, high-stakes ones. Organizations that implement "fast lanes" for pre-approved or low-risk transactions often see a noticeable reduction in variance across the board.
By identifying these inconsistencies, you can start digging into where delays are happening and why.
How to Identify Bottleneck Durations
Once you’ve got a handle on variability, the next step is to pinpoint bottlenecks. This requires more than just looking at the start and end timestamps of a process. To get the full picture, you need to track timestamps at every stage - request intake, approval routing, budget review, vendor readiness, and purchase order creation - over a continuous period. This granular approach exposes specific delays that summary metrics might miss.
Queue time analysis, for example, can show how long requests sit idle versus how long they’re actively being worked on. This can help you identify delays caused by missing budget data or lack of context.
Another important metric to watch is the age of open requisitions. Requests that sit untouched for days often point to missing details, like unclear specifications or unresolved budget issues. Setting up automated alerts - say, for requests that go untouched for more than 48 hours - can shift this from a reactive audit to a proactive safeguard.
Here’s a quick breakdown of key tools for tracking bottlenecks and how often you should use them:
Metric | What It Reveals | Recommended Frequency |
|---|---|---|
Approval Aging | Where delays are happening right now | Daily / Real-time |
SLA Breach Count | How often time limits are exceeded | Weekly |
Bottleneck Approver Analysis | Which individuals are causing recurring delays | Monthly |
Cycle Time Variance | Instability in the process across transactions | Monthly |
These tools, when paired with stage-specific metrics, provide a clearer roadmap for cutting down procurement cycle times and improving overall efficiency.
How to measure or calculate procurement cycle time?
One of the most effective ways to accelerate these calculations and identify bottlenecks is by leveraging AI procurement tools to automate data collection across the P2P cycle.
Using Automation and Compliance Metrics to Reduce Cycle Time
Once you've identified bottlenecks, the next step is to use automation and compliance metrics to speed up cycle times - without compromising quality. These metrics provide actionable insights to streamline processes and save valuable time.
Automation Metrics
Two key metrics to watch are the straight-through processing (STP) rate and the exception rate.
The STP rate measures how many transactions complete the entire procurement process without requiring manual intervention. A higher STP rate indicates that your automation is doing its job effectively. A lower rate? That’s a red flag that manual steps are slowing things down.
The exception rate, on the other hand, tracks how often purchase orders (POs) need changes after they’ve been issued. This is a major source of delays - Gartner reports that 50% of PO lines are modified after issuance. Lowering this rate is one of the clearest ways to reduce cycle time while keeping quality intact.
"Manual approvals are the silent tax on procurement. Each extra email, hallway nudge, or spreadsheet lookup drags cycle times, frustrates budget owners, and leaves Finance blind to real-time cash commitments." - Harsh Singhi, Procurement Automation Professional
Compliance and Quality Metrics
While automation metrics help with speed, compliance metrics ensure the process stays on track. Two essential compliance metrics are spend under management (SUM) and contract compliance rate.
Spend Under Management (SUM): This measures the percentage of total enterprise spend that goes through approved, managed channels. Leading organizations keep SUM between 80% and 90%. Falling below this range often signals "maverick spend" - purchases made outside approved contracts - which leads to manual reconciliation headaches. Companies using procurement automation have cut maverick spend by up to 30%.
Contract Compliance Rate: This tracks how consistently vendors and internal teams stick to agreed terms. Low compliance rates often show up as disputed invoices, pricing errors, or rework, all of which add unnecessary days to the process. Tools like Procright help by automating specification creation, product discovery, and compliance checks, eliminating guesswork and speeding up PO creation.
Setting Benchmarks and Performance Targets
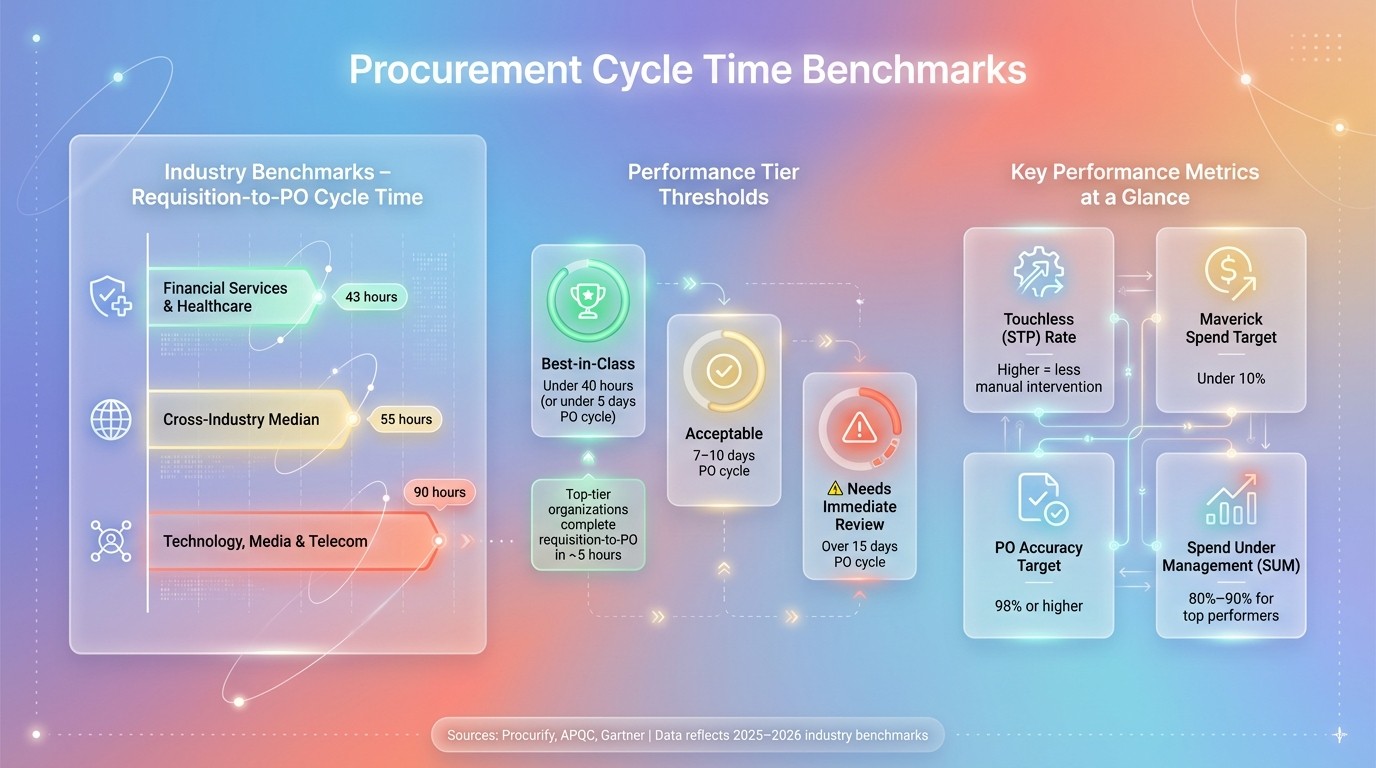
Procurement Cycle Time Benchmarks by Industry & Performance Tier
How to Establish Baseline Metrics
Before making any improvements, it’s essential to understand your current cycle times. Start by mapping out every step in your workflow - from the initial requisition and approval process to PO creation, supplier confirmation, and delivery. Then, collect timestamps for each stage over a month to create a representative data set.
Instead of focusing solely on averages, calculate the p75 and p90 percentiles. These metrics help identify where the longest delays occur, which are often hidden when only looking at averages. This approach ensures you capture the bottlenecks that might frustrate stakeholders. Don’t forget to include off-system spend in your analysis, as leaving it out can distort your data and mask key issues.
"A long PO cycle time does not always mean approvers are slow. It often means the request is missing context, the approval path is unclear, the vendor is not set up, or budget information is not visible." - Michele Kerr, Procurify
With this baseline data, you can begin to identify performance differences across procurement categories, setting the stage for more targeted improvements.
Comparing Metrics Across Categories
When benchmarking, it’s important to account for the natural differences between goods and services. For instance, in 2026, new software purchases averaged 40 days, while renewals took 82 days due to administrative delays and legal reviews.
A practical approach to managing these variations is ABC analysis. For high-volume, low-complexity items (like office supplies), set shorter cycle time targets. Meanwhile, allow more time for high-value, complex purchases (A-items) that involve detailed sourcing processes. To ensure fairness across departments, normalize your data - for example, by calculating cycle time per $1,000 of purchases.
Using Industry Benchmarks to Set Goals
Once you’ve established internal baselines and accounted for category differences, external benchmarks can help set realistic improvement targets. For example, the median requisition-to-PO cycle time across industries is 55 hours, while top-performing organizations can process POs in under 40 hours. Industry variations also play a role: Financial Services and Healthcare average 43 hours, while Technology, Media & Telecom take longer - around 90 hours - due to more complex approval processes.
"Benchmarking is the competitive edge that allows organizations to adapt, grow, and thrive through change." - Marisa Brown, Senior Principal Research Lead, APQC
As a general guide, PO cycle times under 5 days are considered best-in-class. A range of 7–10 days is acceptable, but anything over 15 days suggests a need for immediate review. However, these targets should be treated as flexible guidelines - what’s achievable depends on your industry, team size, and procurement needs.
The table below highlights key metrics worth benchmarking, along with what they measure and the insights they provide:
Metric Type | Definition | Insights Provided |
|---|---|---|
Requisition Cycle Time | Time from PR receipt to final PO approval | Assesses internal process efficiency and approval speed |
PO Cycle Time | Time from purchase request submission to PO issuance | Identifies friction points in intake, routing, and budget visibility |
Procure-to-Pay (P2P) Cycle Time | Time from initial request to final payment | Offers a complete view of procurement and finance alignment |
Supplier Lead Time | Time from PO issuance to goods delivery | Evaluates vendor performance and supply chain reliability |
Touchless Rate | Percentage of POs processed without manual intervention | Measures the effectiveness of automation in reducing cycle time |
While speed is important, it should never come at the expense of accuracy. Faster cycle times that lead to more errors or compliance issues aren’t genuine improvements. Always balance speed with quality checks to ensure your gains are meaningful .
Conclusion: Improve Procurement Performance with the Right Metrics
This guide highlights an important truth: tracking procurement cycle time isn't just about speed - it's about pinpointing where your process falters and fixing those weak spots. The metrics discussed, from requisition cycle time and PO accuracy to touchless rates and procure-to-pay duration, provide a clear view of your procurement efficiency and areas needing attention.
The impact of digitization is striking. For example, optimizing workflows and moving to digital processes can slash requisition cycle times by up to 70%. Similarly, switching from manual to digital procure-to-pay systems reduces purchase order costs from over $300 to as low as $50–$100. These changes don't just streamline operations - they free up funds and resources for more strategic tasks.
"Half your procurement cycle time is vanishing into thin air. Not because your team is slow - because nobody can see where the bottlenecks actually are." - Vishnupriya B, Data Analyst
The secret to improvement lies in visibility. By analyzing each stage of the process, you can zero in on specific areas for improvement. Tracking metrics like p90 cycle times, maverick spend (aiming for under 10%), and PO accuracy (targeting 98% or higher) ensures your efforts are focused and effective. These benchmarks don't just identify problems - they pave the way for actionable solutions.
To support these advancements, Procright provides AI-powered tools that automate tasks like specification creation, compliance checks, and product discovery. By reducing manual effort, Procright aligns with the process improvements outlined here, speeding up procurement cycles and enhancing overall accuracy.
FAQs
What should I use as the start and end dates for cycle time?
When measuring cycle time, use the purchase requisition date as the start date and the final order release or receipt date as the end date. These points create a clear timeline, making it easier to track and improve procurement performance.
How do I find the biggest bottleneck in my process?
To figure out the main bottleneck in your procurement process, start by measuring the total cycle time and then break it into key stages: requisition, approval, purchase order (PO) creation, and delivery. Monitor how long each stage takes over a period of time to identify where delays are happening. Pay close attention to the stage with the most significant delays or the greatest inconsistency.
Common culprits include manual approval processes, poor communication, or supplier delays. Tackling these issues can lead to noticeable improvements in your overall cycle time.
What targets should we set for p75 and p90 cycle time?
For p75 cycle time, most organizations aim for a target between 40–60 hours. However, p90 cycle time can often go beyond 60 hours, especially for more complex processes. These benchmarks can differ depending on the organization and should be tailored to fit your specific procurement objectives and requirements.
Related Blog Posts
Try it on a real buy
Bring one category. Watch where the flags land.
We use a little analytics to see which pages actually help. Nothing else, no ad trackers.