Cost to Serve in Procurement and Supply Chain
Cost to serve makes hidden procurement workload visible, so you can judge suppliers on the effort they create for your team, not only quoted prices.
In this article
You're comparing final bids late on a Friday. Finance wants a recommendation, operations wants delivery certainty, and the lowest quote looks obvious until someone asks who'll handle the clarifications, document checks, approvals, and fixes after award. That's where many buying decisions go wrong. Cost to serve makes that hidden workload visible, so you can judge a supplier on the effort it creates for your organization, not only on the price it quotes.
Why Cost to Serve Changes the Buying Decision
Two suppliers bid for the same equipment package. Supplier A quotes a slightly higher price, submits complete evidence, accepts your delivery pattern, and answers technical questions in one round. Supplier B quotes less, but its documents conflict with the specification, deliveries arrive in many small loads, and your team keeps repairing gaps before anyone can approve the award.
On a price-only spreadsheet, B wins. In real life, B may consume more engineering time, warehouse touches, expediting, and post-award support. Cost to serve captures that difference.

What the aggregate number hides
Averages are comforting because they smooth out trouble. Yet supply-chain analysis cited by Locus reports approximately 12% of customers are loss-bearing because of high distribution and storage costs, as many as 20% of customer orders generate negative profit margins, and 5% to 10% of a product range may contribute no profit at all. The same logic applies when you flip the lens toward suppliers. A high-spend contract can look healthy while small orders, special handling, and repeated exceptions eat the benefit.
A low price doesn't help if your team pays the difference back in rework, waiting, and manual control.
Cost to serve doesn't replace commercial judgment. It gives you a structured way to ask better questions before you sign. Which supplier creates work? Which specification creates exceptions? Which delivery term moves cost from the supplier's quote into your warehouse, help desk, or audit file? Once you can answer those questions with evidence, the cheapest bid and the best buying decision stop looking identical.
Understanding the Cost to Serve Concept
Conventionally, cost to serve measures the activities and costs incurred across the value chain to deliver products or services to customers, often analyzed by customer, product, or channel. This article adapts that activity-based approach to the buyer’s side: the internal workload of specifying, sourcing, approving, receiving, and supporting a purchase. That buyer-side procurement-service cost is one component of total cost of ownership, not a replacement for the full acquisition, operating, maintenance, and end-of-life cost model.

The concept became formal through activity-based costing, or ABC. Research tracing the history of cost-to-serve connects the term to Kaplan in 1989, Cooper and Kaplan in 1998, and Braithwaite and Samakh in 1998. ABC maps individual activities such as order processing, delivery, warehousing, returns, and support, then assigns costs using drivers such as time, volume, order count, or shipment frequency.
Three ideas readers often mix up
Unit price is what the supplier charges for an item or service. It says nothing about your internal effort.
Total cost of ownership is broader. It usually includes acquisition, operation, maintenance, and disposal over an asset's life. If you're building that wider view, it helps to calculate total cost of ownership before you issue the PO, then use cost to serve to examine the service workload inside that total.
Cost as a percentage of spend is the shortcut to avoid. Two categories can have identical spend and very different workloads. One needs a clean catalog order. The other needs technical evaluation, compliance evidence, site coordination, and repeated approvals. A percentage treats them as equals and hides the operational problem you need to manage.
For this buyer-side adaptation, define the cost object, such as a supplier, contract, order, or sourcing event, and state exactly which procurement-service activities are included. Change the object or the activities, and you have changed the metric. Do not compare this bounded workload measure directly with a customer-facing cost-to-serve benchmark or a full total-cost-of-ownership estimate.
Calculate Cost to Serve Step by Step
Start with the activities, not with the finance ledger. Ledgers tell you which department spent money. They rarely tell you which sourcing event caused the work.
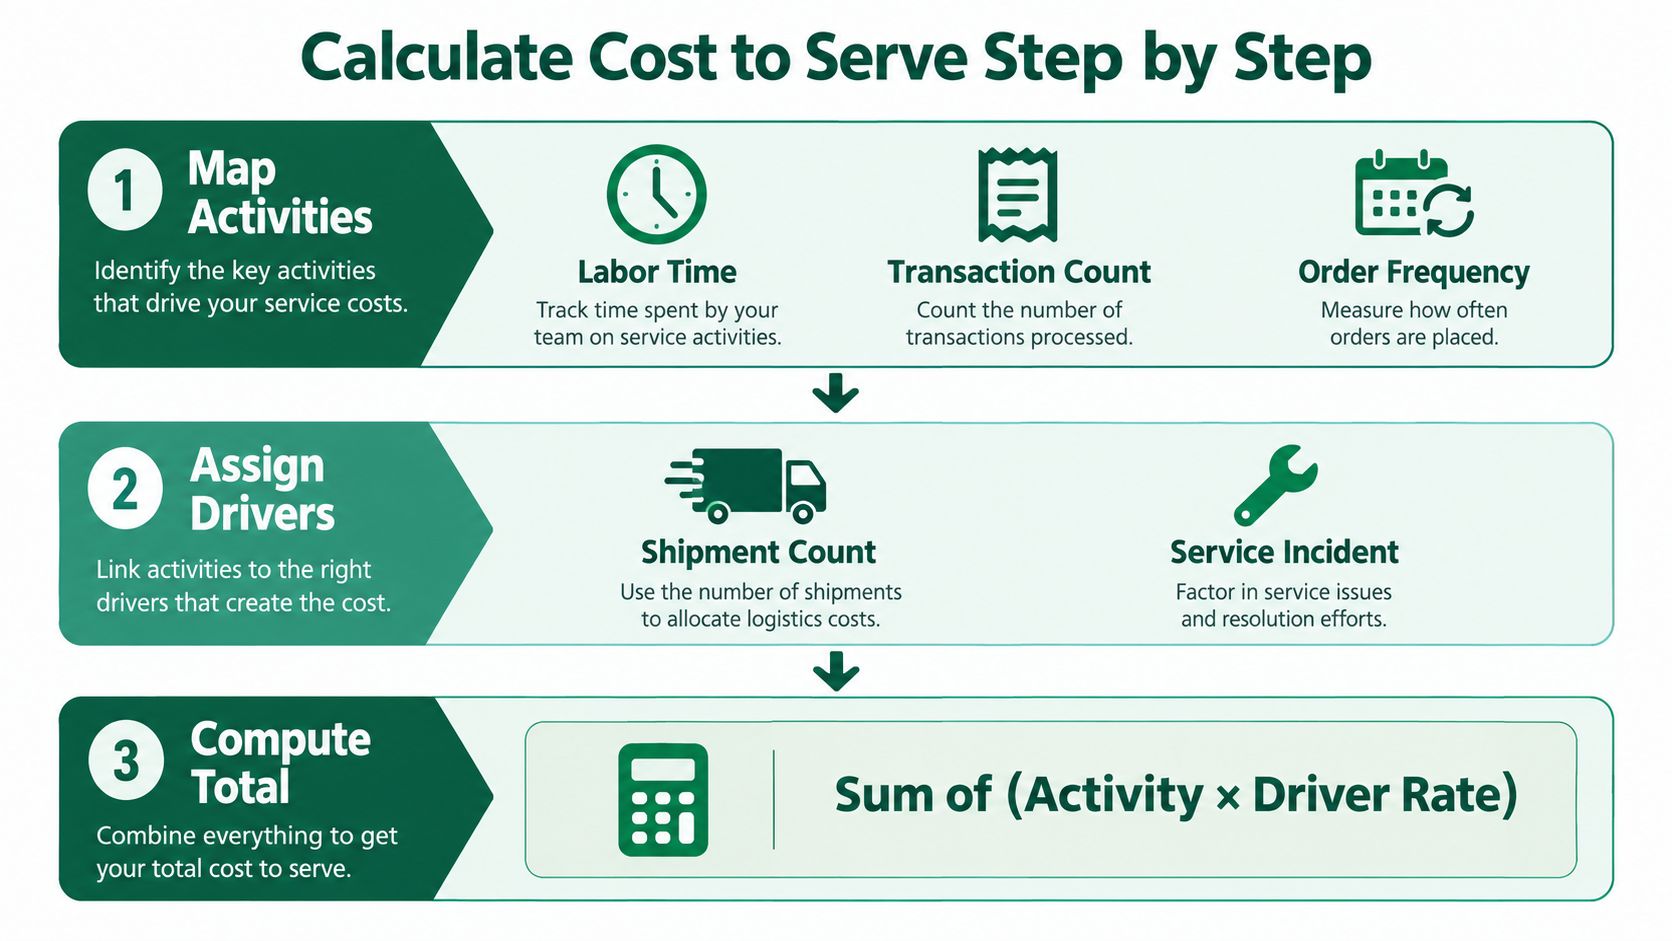
Layer one and layer two
First, map each activity to a driver you can observe. Specification repair uses labor hours. Supplier screening uses suppliers reviewed. Clarifications use rounds or questions. Approvals use touches. Deliveries use shipment count. Support uses incidents.
Second, assign a rate to each driver. Use a loaded labor rate for internal time, a carrier charge for a shipment, or a system transaction cost where you have one. Label every input as observed, estimated, or allocated. That label prevents a planning estimate from masquerading as an audited actual.
Item | Formula | Plain meaning |
|---|---|---|
Activity cost | Driver quantity × driver rate | What one type of work cost |
Cost to serve | Sum of all activity costs | Total service workload cost |
Unit cost to serve | Cost to serve ÷ events, orders, or qualified suppliers | Cost for one decision unit |
Contribution after service | Value or margin − cost to serve | What remains after workload |
A short walkthrough can help you see how activity mapping turns into a usable rate before you apply it to your own categories.
Layer three and a useful benchmark check
Third, add the activity costs and present the result at the level where someone can act. Cost per sourcing event helps category managers. Cost per qualified supplier helps sourcing leads. Cost per order helps operations. Portfolio cost helps finance see where complexity concentrates.
Transaction-level discipline matters because small purchases still trigger requisition, approval, receiving, and exception work. Hackett Group research summarized by Ivalua reports peer purchase-order processing at $14.48 per order versus $3.33 for top performers, about a 77% difference. That metric covers labor and outsourcing cost divided by annual purchase-order and blanket-release transactions, with specified exclusions. Don't copy the number blindly into your model. Copy the discipline. Define the transaction, count it consistently, and separate supplier price from the process cost your organization creates or absorbs.
Identify the Main Cost to Serve Drivers
A single overhead pool tells you cost exists. It doesn't tell you what to fix. Break the workload into activity families, then look for the family that changes the decision. The diagram below shows the buyer-side procurement-service adaptation used in this article, not the conventional customer-facing cost-to-serve model.
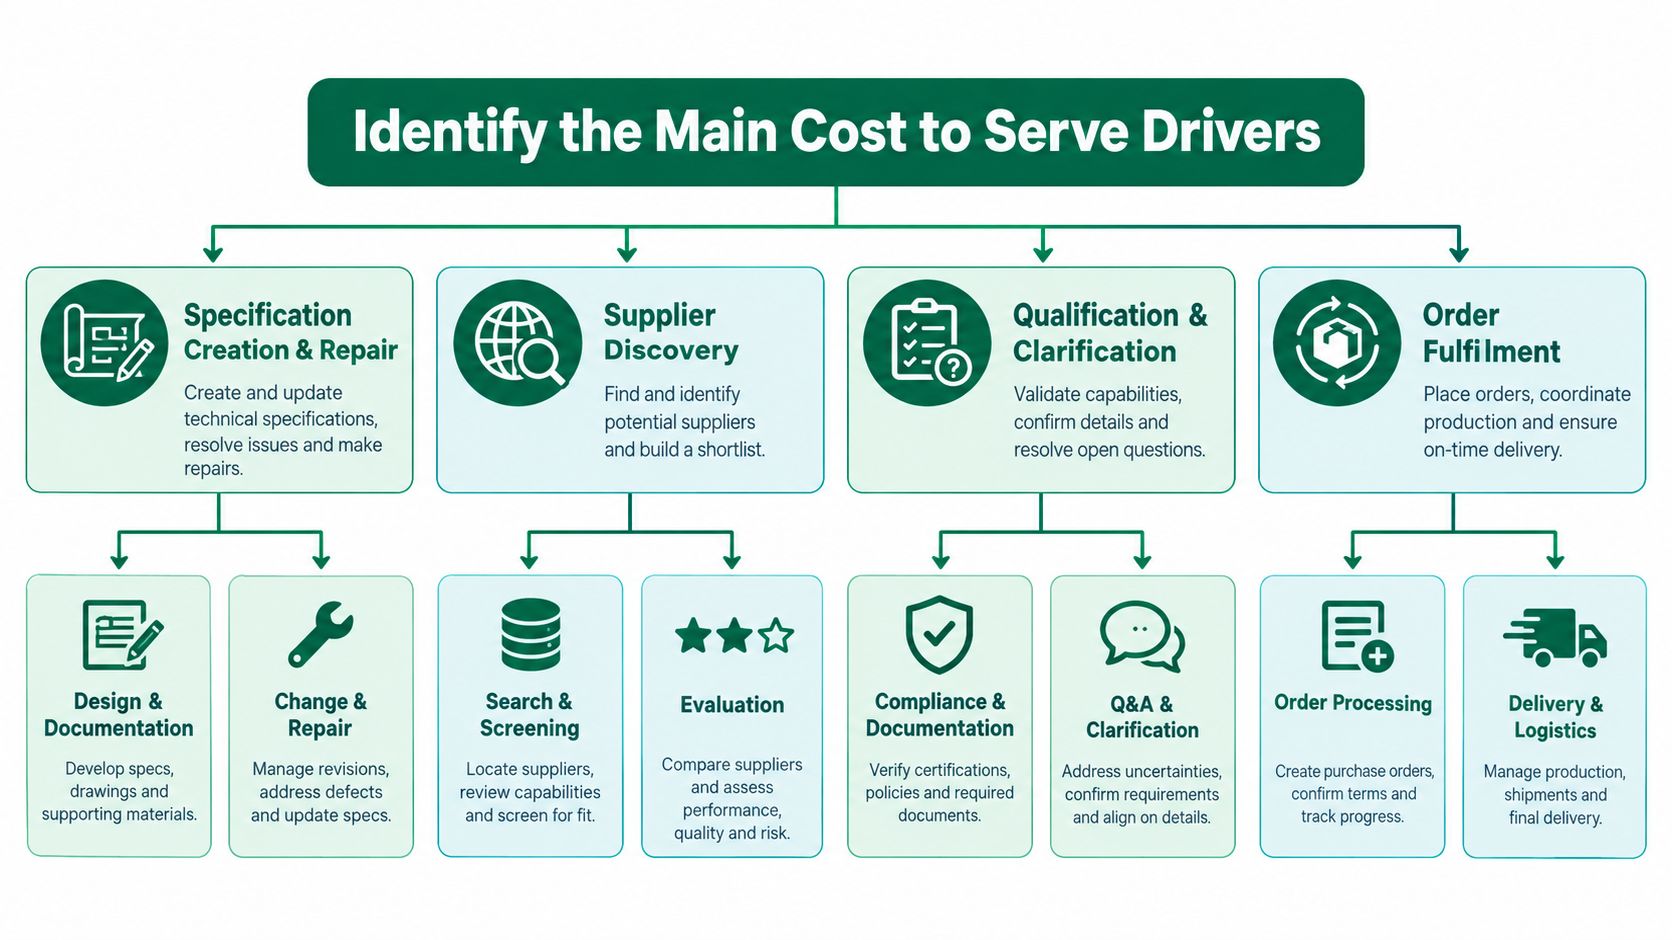
Before and during the transaction
Specification creation and repair: Drafting requirements, closing gaps, and removing wording that points to only one bidder. The driver is usually labor time or revision count, and a high value signals unclear demand.
Supplier discovery and qualification: Searching, screening, checking evidence, and scoring compliance. Count suppliers screened, documents reviewed, and clarification rounds.
Approval and order administration: Requisition handling, approval touches, purchase-order changes, and invoice matching. Manual work here can dwarf a small purchase. A procurement benchmark summary citing APQC reports fully automated procure-to-pay transactions at roughly $5 to $10 each, while median purchase-order cost ranges from $50 to more than $500 across maturity levels. The same summary cites approximately €25 for dematerialized catalog orders versus €95 for manual orders.
After award, where costs stop behaving nicely
Fulfillment and receiving rise with shipment frequency, split deliveries, inspection needs, and storage time. Exceptions behave differently. A failed delivery, warranty claim, return, or urgent replacement can create a spike that no average rate predicts well.
Specification choices drive some of those spikes. If you are sourcing technical detection equipment, model calibration, site access, evidence review, and service escalation separately from the quoted equipment price.
Practical rule: Model standard work with rates, and model exceptions as scenarios. Blending both into one average hides the event that hurts.
Also separate variable work, which rises with each order or incident, from fixed or semi-fixed work, such as maintaining a contract or preparing for audit. Too little detail hides complexity. Too much detail creates narrow cost buckets that are expensive to maintain and easy to allocate arbitrarily. Aim for the smallest driver set that changes a specification, delivery term, service level, or supplier choice.
Build a Defensible Cost to Serve Model
Adoption is still limited, and the reason is understandable. Deloitte's 2025 profitability research reports that only 38% of surveyed organizations use cost-to-serve analysis. ABC can demand exhaustive activity lists and heavy data collection, so teams either build a spreadsheet monster or give up. A defensible model takes the middle path.
A minimum viable sequence
Define the decision: State whether you'll choose a supplier, redesign a specification, set a minimum order quantity, or change a service level.
Define the object: Pick one unit, such as a sourcing event, contract, category, location, or order type, and don't switch mid-analysis.
Map only material activities: Include work that could plausibly change the decision. Park minor activities in a documented exclusion list.
Connect operations to finance: Pair event counts from procurement systems with labor rates and service charges owned by finance.
Document assumptions: Record the driver, rate, source, owner, date, and version for every allocation.
Validate with real transactions: Test the model against a few known events and ask the people who did the work whether the result feels directionally right.
Show confidence, not false precision
Mark each line as measured, estimated, or allocated. A timesheet record is stronger than a manager's memory. A carrier invoice is stronger than a standard freight allowance. When evidence is weak, show a range and say why.
Pilot the model on one representative category before scaling it. You'll learn which data owners respond, which drivers spark arguments, and which activities nobody can count reliably. Fix those problems while the model is small. A modest model with traceable evidence will survive finance and audit review far better than a detailed model that depends on heroic timesheet collection.
Work Through Procurement Examples
Examples make the arithmetic concrete. The values below are illustrative teaching numbers, not benchmarks and not predictions for your category. Their purpose is to show how the ranking can change when workload enters the picture.
Two suppliers, one requirement
Your team needs the same service package from either supplier for one year. Supplier A quotes 100,000 in your chosen currency. Supplier B quotes 96,000. Both meet the mandatory requirements, so you model the service workload.
Activity | Supplier A | Supplier B |
|---|---|---|
Specification repair | 4 hours × 80 = 320 | 18 hours × 80 = 1,440 |
Clarification rounds | 1 round × 400 = 400 | 4 rounds × 400 = 1,600 |
Deliveries to receive | 12 × 150 = 1,800 | 40 × 150 = 6,000 |
Approval and document checks | 12 × 60 = 720 | 40 × 60 = 2,400 |
Expected support incidents | 3 × 300 = 900 | 8 × 300 = 2,400 |
Total cost to serve | 4,140 | 13,840 |
Quote plus cost to serve | 104,140 | 109,840 |
B's apparent saving of 4,000 becomes a disadvantage once workload is added. If you want to test whether the quoted figure itself is sound, break down price into its components before you add your internal service cost. Keep those two analyses separate, or you'll double count supplier charges that already sit inside the quote.
When exceptions dominate the average
Now add a failure scenario. B's split deliveries increase the chance of inspection, expedited replacement, and rework. Don't bury that risk in the standard rate. Show a standard case and an exception case side by side, with the trigger written in plain language.
Returns work shows why this separation matters. A returns-focused analysis from Retail Ops Toolkit argues that tracking only the formal returns budget can understate total handling costs by 30% to 50%, and that misclassified returns overhead can depress measured category margin by 100 to 400 basis points. Freight, inspection, refurbishment, service, payment fees, inventory carrying cost, and value loss often sit in different budgets. Procurement exceptions scatter in the same way.
That's why a range is often more honest than a point estimate. Standard service, peak demand, failure recovery, and unusual exceptions have different economics. State which scenario you're pricing, who bears the cost under the contract, and what evidence supports the assumption.
Use Cost to Serve for Sourcing and Supplier Selection
Use the metric as one lens in a structured decision, not as an automatic ranking machine. A supplier with low service cost can still be the wrong choice if it fails a safety, compliance, or capacity requirement.
Keep gates separate from scores
First apply mandatory gates. A bid that can't meet a mandatory specification, legal duty, delivery constraint, or evidence requirement is out, whatever its cost to serve looks like. Only surviving bids enter weighted evaluation.
Decision layer | Question to answer | Evidence to keep |
|---|---|---|
Mandatory gate | Does the supplier meet every must-have requirement? | Requirement-level source and pass or fail reason |
Commercial comparison | What is the normalized quoted price? | Priced scope, exclusions, and quote drift checks |
Cost to serve | What workload will this supplier create for us? | Drivers, rates, scenarios, and assumption versions |
Risk and service | What happens during peaks or failure? | Service terms, recovery duties, and support record |
Pairing this with should-cost analysis helps you separate what a supplier should reasonably charge from the internal cost of working with that supplier. For ongoing governance after award, structured approaches to vendor management for product teams from Genpire can be a useful reference when you're deciding which supplier interactions, reviews, and escalation paths deserve management time.
Turn findings into sourcing levers
The value appears when a driver points to a lever. Repeated clarifications suggest a tighter specification or a structured question limit. Many small deliveries suggest minimum order quantities or consolidated delivery windows. Heavy evidence checking suggests standardized compliance packs. Frequent escalations suggest clearer acceptance criteria, service levels, and remedy clauses.
Tools can support that discipline if they preserve evidence rather than just speed up documents. Procright, for example, drafts specifications, discovers and scores suppliers, and cites evidence for requirement-level answers, which gives reviewers a traceable record of why a supplier stayed in or was eliminated. Whatever tool or spreadsheet you use, insist on the same test. Can a reviewer reconstruct the decision later, see the source behind each claim, and understand why workload assumptions were set that way?
Adopt Cost to Serve with Better Decisions
Start smaller than your ambition. Pick one consequential category where stakeholders already argue about hidden effort. Define the decision, map only the activities that could change it, collect the best available evidence, calculate a baseline, and validate it with the people who do the work. Then turn the largest driver into one corrective action and measure again.
Services make the discipline tangible. When facilities leaders compare office-cleaning packages, the quoted package is only the starting point. Site access, inspection frequency, complaint handling, schedule changes, and contract administration still determine how much internal effort each option creates.
Keep four distinctions in view. Price isn't workload. A percentage of spend isn't a unit of analysis. Averages can conceal loss-making orders and exception-heavy contracts. More detail isn't automatically better, especially when detail depends on unreliable time estimates.
Build the least detailed model that changes a real decision, then prove it with evidence.
Used well, cost to serve sits alongside total cost of ownership, compliance, risk, service quality, and negotiation judgment. It won't tell you which supplier to love. It will show you which choice asks your organization to do the supplier's work, and that visibility is often enough to produce a better specification, a cleaner contract, and a more defensible award.
If you're ready to judge suppliers on quoted price, service workload, and evidence rather than price alone, Procright can help you draft tighter specifications, discover and score suppliers against each requirement, and preserve an audit-ready decision record for every award. Start with one live sourcing event, expose the activities that drive your cost to serve, and use the cited record to defend the choice long after signature.
Try it on a real buy
Bring one category. Watch where the flags land.
We use a little analytics to see which pages actually help. Nothing else, no ad trackers.