Should Cost Analysis: A Practical Guide for Procurement
A should-cost model gives procurement an independent view of what a product or service should cost, exposing the assumptions behind any supplier quote.
In this article
A supplier sends a renewal quote, and the number is higher than last year. Finance asks whether the increase is justified. The supplier points to labor, freight, inflation, tooling, risk, and “market conditions.” Your spreadsheet shows historical spend, but it doesn't show what the product or service should cost today.
That's where should-cost analysis earns its place. Done properly, it gives procurement an independent view of cost, exposes the assumptions inside a quote, and creates a negotiation position that can withstand supplier pushback. Done badly, it becomes a detailed spreadsheet built on stale data and weak assumptions.
The practical standard is simple: every important line in the model should connect to a defensible cost driver, and every assumption should be easy to refresh when the market changes.
When You Walk Into a Negotiation Without a Target Price
A category manager walks into a renewal meeting with a three-year managed services proposal. The supplier's quote is materially above the previous term, but the buyer has no independent cost baseline. The internal team knows the increase feels excessive. It doesn't know which roles, rates, tools, transition activities, or risk allowances create the gap.
The supplier controls the conversation immediately. It explains the increase as a combined effect of wage pressure, service complexity, technology changes, and delivery risk. The buyer asks for a discount, receives a concession on a visible commercial term, and leaves believing there was progress. The underlying price remains difficult to defend internally because nobody can explain what the service should reasonably cost.
Should-cost analysis fixes that imbalance by building an independent estimate of the cost required to produce a product or deliver a service under defined assumptions. It isn't a prediction of the supplier's books, and it isn't a request to accept historical contractor spending as the truth. In federal procurement, FAR 15.407-4 defines should-cost reviews as a specialized form of contract cost analysis, while FAR 15.404-1 frames cost analysis as a judgment about whether proposed costs represent what a contract should cost under reasonable economy and efficiency.
What the model changes in the room
A useful model gives the buyer three forms of power:
A defensible target: You can explain the expected cost from labor, materials, process, logistics, overhead, and margin assumptions.
A line-item challenge: You can question a cycle time, staffing mix, freight allowance, yield assumption, or risk premium instead of arguing about the total quote.
A calmer negotiation: The discussion moves from “your price is too high” to “which assumption explains this variance, and what evidence supports it?”
The model must survive disagreement. A supplier may reject your rate, routing, utilization assumption, or volume forecast. That's acceptable. The purpose isn't to produce a number nobody can challenge. The purpose is to make each challenge visible and testable.
For categories that depend on changing external data, teams may also need structured market information rather than occasional manual research. Resources such as browse managed web data operations can help procurement teams think about how to collect and maintain external data inputs, but the buyer still has to decide which sources are relevant and defensible.
Negotiation rule: Never ask a supplier to justify the total price when you can ask it to explain the cost driver creating the largest variance.
Building the Data Foundation Before You Model
A should-cost model is only as credible as its inputs. Start with evidence that traces cost to a physical feature, production activity, or defined service requirement. Use broad market data to fill gaps, not to disguise missing fundamentals.
Rank inputs by how directly they explain cost
Engineering bills of materials, drawings, manufacturing routings, supplier quotations opened into component lines, and rate cards belong at the top of the hierarchy. They let you connect a cost to something concrete, such as material grade, part weight, machining time, technician skill, or license requirement.
Market indices, regional labor rates, freight references, currency assumptions, and duty information provide useful context. They're valuable for testing whether a supplier's inputs are current, but they're usually less specific than a drawing, a measured cycle time, or a contractually defined staffing plan.
Internal spend history belongs lower in the hierarchy. It tells you what the organization paid, not what the supplier should spend today. Historical invoices can identify unusual movements and recurring price differences, but they shouldn't become the cost basis without further validation.
Data Source | Reliability | Best Used For |
|---|---|---|
Drawings, BOMs, routings, and defined service requirements | High | Connecting cost to product geometry, process, scope, or labor activity |
Opened supplier quotes and rate cards | High | Testing quoted line items and commercial assumptions |
Current material, labor, freight, currency, and duty references | Medium to high | Refreshing external cost drivers and regional assumptions |
Internal spend history | Medium to low | Detecting price variance and identifying areas for investigation |
Unexplained supplier allowances | Low | Generating questions, not setting the target |
Test the data before opening the spreadsheet
Check whether the drawing matches the quoted revision. Confirm that the BOM includes packaging, consumables, and expected wastage. For services, reconcile the role mix and location assumptions with the actual scope, service levels, coverage model, and transition plan.
Don't treat overhead as a percentage copied from a previous negotiation. Ask what capacity, facility, supervision, quality, information systems, and support activities it covers. Logistics also deserves its own calculation. A route-based landed-cost view is more useful than a generic freight percentage.
Teams consolidating information from multiple systems should account for conflicting definitions, missing fields, and duplicate records. The discussion in cross-source data consolidation challenges is relevant because a model can fail before the analysis begins if its source data doesn't align.
Senior buyers often spend more time obtaining and validating inputs than formatting the model. That's time well spent. A polished workbook built on an outdated quote, an incomplete BOM, or an assumed labor mix only creates the appearance of control.
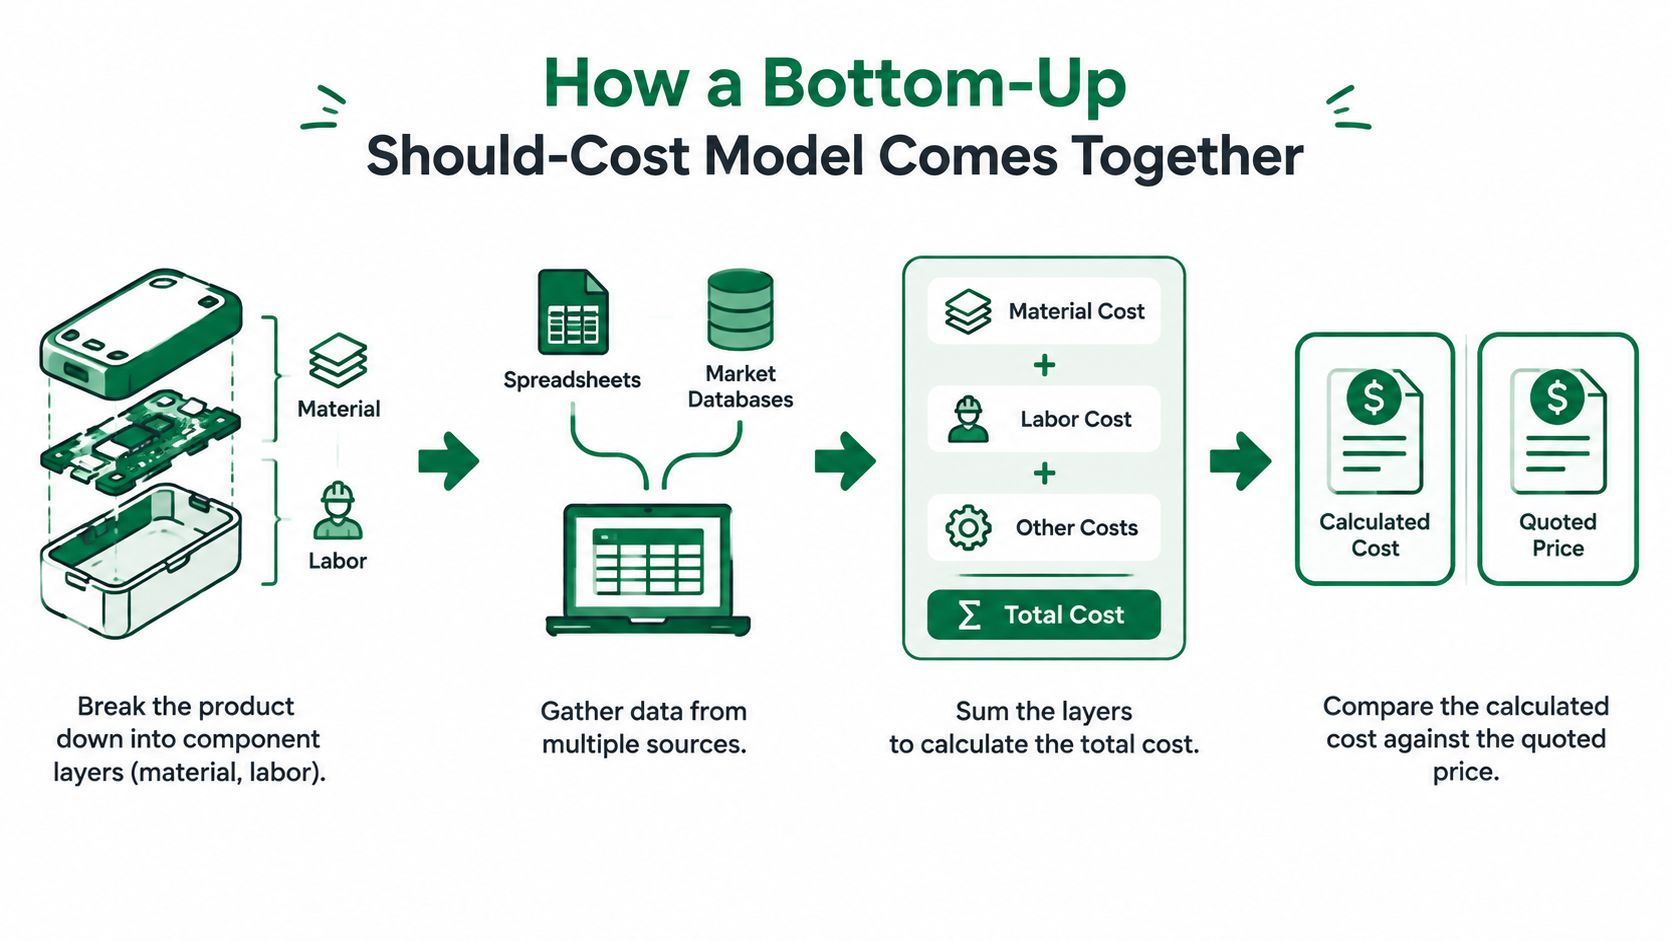
How a Bottom-Up Should-Cost Model Actually Comes Together
A bottom-up model starts with the thing being bought, then works outward through the activities required to make, deliver, support, and manage it. The sequence matters because it prevents the supplier's bundled price from becoming the starting point.
Begin by defining the scope and commercial assumptions. Lock the product revision, annual demand, delivery location, service coverage, payment terms, warranty expectations, and currency. If those assumptions remain vague, the model will produce a false comparison between unlike offers.
Build the cost stack from observable drivers
For a manufactured product, price the raw material against a current market reference, then account for scrap, yield, and purchased components. Map the manufacturing route from cutting or forming through machining, finishing, inspection, packing, and shipment. Estimate cycle time and setup time from geometry, process requirements, and measured operating conditions where available.
Apply machine, labor, and overhead rates only after the process is visible. Capacity assumptions matter. A machine rate based on full utilization can make the target look artificially low, while a rate based on idle capacity can make it unreasonably high.
Tooling should appear separately, including amortization assumptions. Freight and duty should also remain visible rather than disappearing inside a broad overhead line. The classic should-cost modeling method follows this kind of bottom-up logic and emphasizes current inputs, manufacturing routing, cycle and setup times, rates, and tooling.
Keep margin layers separate
Manufacturing margin, SG&A, and risk premium should not be buried inside one overhead percentage. Separate layers make the negotiation more productive because the supplier can explain whether the variance comes from production economics, corporate allocation, or commercial return.
Margin often hides in three places:
Bundled overhead: Shared support costs are allocated without showing the basis.
Yield assumptions: Scrap and rework allowances reflect old processes or conservative estimates.
Freight markup: Logistics is priced as a percentage rather than against an actual route and service requirement.
For a service, replace physical components with roles and activities. Model billable hours by skill band, location, utilization, coverage, transition work, tools, licenses, and management. A blended rate can be tested by reconstructing the underlying mix of senior, intermediate, and junior resources.
The model doesn't need false precision. It needs traceability. Every material rate, labor assumption, process time, and margin layer should point to evidence that the supplier can challenge specifically.
Teams exploring technology-assisted approaches can also review AI procurement predictive cost modeling explained, especially when manual analysis leaves too many parts, services, or supplier inputs outside coverage.
Bottom-Up Models Versus Market Benchmarks
Bottom-up should-cost analysis and market benchmarking answer different questions. Bottom-up asks what the item should cost based on its inputs and production or delivery method. Benchmarking asks what comparable buyers and suppliers have accepted for similar work.
Dimension | Bottom-Up Should-Cost | Market Benchmarking |
|---|---|---|
Primary input | Materials, labor, process, overhead, logistics, and margin assumptions | Comparable transactions, quotes, catalog prices, and market references |
Strongest use | Transparent cost structures with traceable drivers | Opaque categories where internal cost detail is unavailable |
Main advantage | Explains why the price should be at a given level | Establishes a fast external price corridor |
Main weakness | Can take substantial effort and miss supplier-specific advantages | Can drift toward incumbent pricing or poor comparables |
Negotiation role | Challenges the cost stack line by line | Tests whether the total offer fits the market |
Bottom-up wins for fabricated metal parts, standard hardware, and defined service labor bands. The buyer can test material, labor, routing, utilization, and logistics assumptions without accepting a supplier's bundled explanation.
Benchmarking is more useful for complex SaaS bundles, integrated logistics, or services where the supplier's operating model isn't transparent. It also wins when the team needs a fast commercial view and doesn't have the time or data to build a detailed model.
The mature approach is layered. Use benchmarks to establish a reasonable corridor, then use bottom-up analysis to pressure-test the cost stack when the supplier contests the corridor. Don't let the benchmark become an average of incumbent prices, and don't let the bottom-up model ignore scale advantages, proprietary automation, or a supplier's actual footprint.
Before choosing which method carries more weight, document the filters for comparable transactions and the assumptions behind the cost model. If they disagree, let the more transparent and current evidence override the less relevant source. A detailed model based on stale rates shouldn't defeat a fresh, well-filtered market comparison.
Applying Should-Cost to IT Hardware and Services
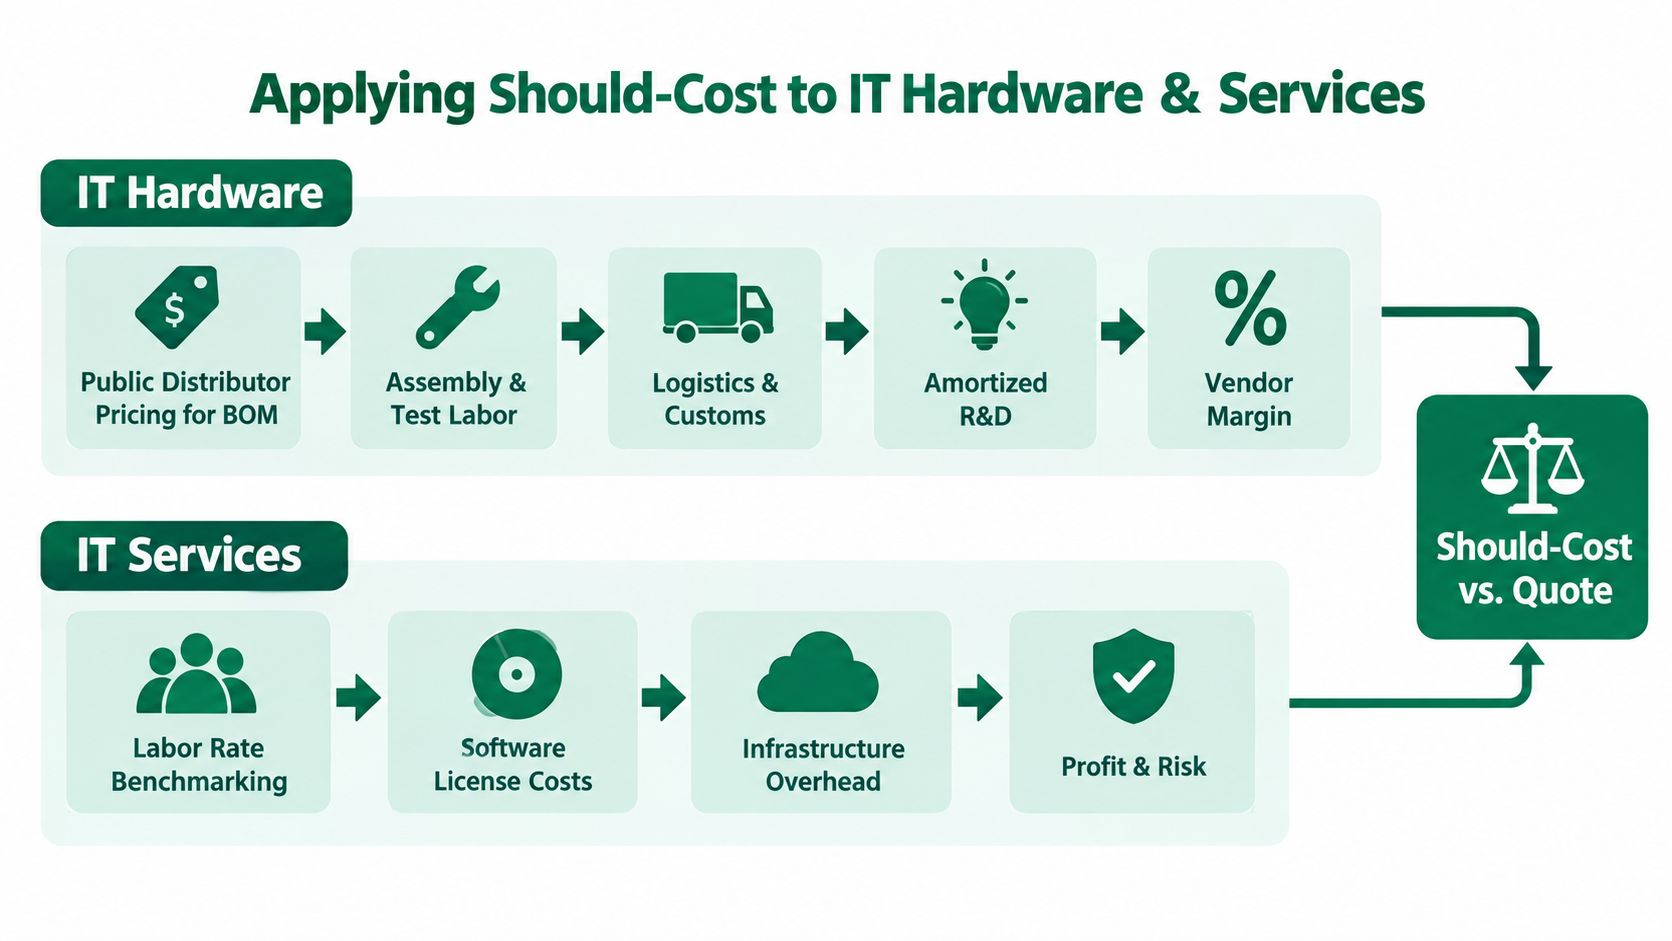
IT hardware looks like an easy should-cost category because many components are visible. That assumption is only partly right. The buyer can often identify the bill of materials, distributor pricing, assembly and testing activity, logistics, warranty exposure, and supplier margin, but the quote can still hide meaningful assumptions in shared overhead, foreign exchange, and support reserves.
For a laptop refresh, server, or network switch, start with the quoted configuration and map each major component to public distributor or second-source pricing. Check whether the supplier has included memory, storage, power supplies, accessories, operating system licensing, security features, and support coverage. Then add assembly, testing, packaging, shipment, customs, warranty reserve, and a separately stated margin layer.
Hardware pressure points
The most useful challenge isn't “your hardware is overpriced.” It's “which part of the quoted configuration or commercial stack explains the variance?”
Look closely at:
Warranty accruals: Ask whether the reserve reflects the actual support obligation and failure exposure.
Shared overhead: Test the allocation basis for sales, technical support, warehousing, and administration.
Foreign exchange: Confirm the currency, conversion date, and exposure period for imported components.
Logistics: Rebuild the route using the actual destination, service level, customs treatment, and packaging requirement.
A supplier may have genuine scale advantages that a public price check won't capture. That doesn't invalidate the model. It tells you to separate observable market inputs from supplier-specific claims and ask for evidence for the difference.
Services require a different lens
Managed services are mostly a labor and operating model question. Build the estimate from role mix, location-based rates, utilization, coverage hours, tooling, licenses, transition work, governance, and risk. A supplier's blended rate can conceal a heavier senior resource mix than the scope requires, or promise productivity gains that the operating model can't deliver.
The model breaks when the original RFP contains vague scope, when service volumes are uncertain, or when transition tasks are treated as recurring delivery. Ask which assumptions change if demand falls, tickets rise, locations expand, or service levels tighten.
For broader total-cost decisions around technology estates, procurement teams may find smart IT investments Canada useful as a separate lens on ownership costs rather than quoted purchase price alone.
This video provides another way to frame the relationship between cost structure and commercial evaluation:
Take two questions into the meeting:
Pressure-test the quote: What does your cost stack look like at zero margin?
Which line item moves most if volume halves?
Use the answers to identify fixed costs, variable costs, and assumptions that deserve a revised offer. For IT sourcing teams, a documented procurement RFP process for IT buyers also helps preserve the scope and evidence needed for a meaningful model.
Why a Highly Detailed Model Can Still Be the Wrong Model
More detail doesn't automatically create better value. A sixty-line model built months ago can be less useful than a coarse model refreshed last week if tariffs, labor rates, freight, compliance costs, or supplier locations have changed.
This is precision theater. The workbook looks rigorous, so the buyer trusts it. The supplier then identifies the stale assumptions first and spends the negotiation defending those lines. The buyer ends up arguing over an obsolete labor rate or a commodity index that no longer reflects the commercial environment.
The stale-input pattern
Watch for these warning signs:
Frozen labor rates: The model uses old plant or regional rates without checking the supplier's current footprint.
Unrefreshed commodity references: Material assumptions remain tied to a prior market position.
Fixed currency cases: The model treats a base exchange-rate assumption as permanent.
Missing compliance costs: New documentation, reporting, data-localization, or sustainability obligations sit outside the cost stack.
Static logistics: Freight and customs allowances ignore route changes, capacity constraints, or policy shifts.
Recent procurement guidance argues that traditional should-cost models can become stale as tariffs, labor, logistics, and compliance costs move, and that relevance matters more than precision when inputs are incomplete or changing. Cost clarity at scale also highlights the broader shift toward continuously updated cost intelligence rather than a one-time worksheet.
Refresh by event, not habit
Tie model updates to events that change the economics. A tariff change, supplier footprint move, new automation investment, force majeure event, or material design change should trigger a review immediately.
Give every major driver a confidence rating. Mark the assumption as high confidence when it comes from a current quote or measured process, medium confidence when it relies on a market reference, and low confidence when it depends on a supplier assertion or an unresolved scope question.
The negotiator's advantage often comes from simplicity. A shorter model with five current, defensible assumptions can beat a complex workbook with dozens of stale lines. If you can't defend a line under questioning, remove its authority from the target price.
Negotiation Checklist and Model Refresh Triggers
Before the meeting, validate the model as if the supplier will challenge every important assumption. Don't open with the total target. Open with the few cost drivers that explain the largest commercial differences.
Use this pre-meeting checklist:
Confirm market inputs: Check the latest material, labor, freight, currency, tariff, and duty references.
Validate the footprint: Ensure labor and overhead rates reflect the supplier's actual plant, delivery location, and operating model.
Reconcile the scope: Match the model to the latest drawing, BOM, forecast, service level, warranty, and support requirement.
Separate cost layers: Keep production cost, overhead, logistics, margin, risk, and one-time charges visible.
Prepare variance questions: Identify which assumptions explain the gap and what evidence would change your position.
Rebuild when the economics move
A casual update isn't enough after a major change. Rebuild the model when:
Tariffs or trade rules change: Recheck landed cost, sourcing routes, and country-of-origin assumptions.
The supplier moves production: Reprice labor, overhead, freight, duty, quality, and transition requirements.
The supplier adds tooling or automation: Test whether the investment changes cycle time, labor content, yield, or amortization.
A disruption changes delivery conditions: Reassess capacity, premiums, inventory, and risk allowances.
Compliance requirements expand: Include new reporting, traceability, environmental, data, or localization costs.
The design or service scope changes: Reconfirm every affected driver rather than editing only the total.
Treat an old model as a hypothesis in a volatile category. Refresh assumptions at least quarterly when conditions are moving, and use event triggers whenever they occur. The point isn't to maintain a perfect spreadsheet. It's to keep a negotiating position connected to the economics that apply on the day of the meeting.
Procright supports sourcing teams with specification analysis, supplier discovery, evidence-backed compliance comparison, quote drift detection, structured supplier responses, and audit-ready decision records. If you want to connect should-cost assumptions with a more traceable sourcing workflow, visit Procright and test how it can support your next procurement event.
Try it on a real buy
Bring one category. Watch where the flags land.
We use a little analytics to see which pages actually help. Nothing else, no ad trackers.