ROI Tracking for AI-Powered Procurement Platforms
Track clean baselines, invoice-level realized savings, and usage data to prove AI procurement platform ROI to finance.
In this article
AI procurement ROI is hard to prove unless I track three things from day one: a clean baseline, invoice-level savings, and usage data.
Here’s the short version:
Most ROI cases fail on data, not math. Nearly 49% of procurement leaders say data accuracy is their top ROI problem.
Direct savings alone are too narrow. If I ignore time savings, compliance gains, and cost avoidance, I can miss a large share of platform impact.
Attribution is the sticking point. About 67% of CPOs say proving the platform caused the result is the main barrier.
Realized savings matter most. Signed contracts do not equal money in the bank. Finance wants savings tied to actual invoices.
Baseline gaps weaken the case fast. If I don’t log procurement cycle time metrics, maverick spend, and compliance rates before rollout, the “before vs. after” story gets thin.
What I’d focus on first:
Use one ROI formula:(Annual Savings - Annual Platform Cost) ÷ Annual Platform Cost
Build a 12-month baseline when possible
Separate hard savings from soft gains
Track usage, compliance, and data quality monthly
Link POs, contracts, and invoices so savings can be checked against paid spend
Put simply: if I can’t trace savings to clean data and paid invoices, finance won’t count it. The article shows how to set up that tracking without turning ROI into guesswork.
The Main Problems That Distort ROI Measurement
Fragmented Data and Missing Baselines
ROI falls apart when spend coverage, baselines, and classification are patchy. If spend isn’t tracked, savings don’t show up. That’s a big deal because most procurement teams manage only 55–70% of total spend. In plain English, a large chunk of buying activity never makes it into the math.
Then there’s the baseline issue. A lot of teams roll out an AI platform before they document core starting points like cycle times, maverick spend rates, or compliance benchmarks. When that happens, any later lift is hard to prove. You may feel progress day to day, but finance won’t accept “it seems better” as evidence.
Data quality adds another problem. AI tools need at least 85% spend classification accuracy to produce insights you can trust. If categories are messy or inconsistent, the ROI story gets shaky fast.
Once the baseline is weak, the next problem is how teams classify and count gains.
Hard Savings Are Counted, Soft Benefits Are Ignored
Most teams start with direct savings. That makes sense, but it leaves a lot on the table. Time saved, better compliance, and faster cycle times often get pushed aside. Gartner estimates that procurement functions capture only 64% of analytics value, and teams that track only direct cost savings miss about 75% of the total value created by AI automation.
Cycle time cuts are a good example. They can free up working capital and let the team handle more work, yet those gains rarely show up in a standard savings report.
Take a procurement team that saves 40–60% of staff time on transactional work. If that time is shifted to supplier negotiations, the business gets real value back. Ignore that, and ROI looks smaller than it is.
Even if teams count benefits the right way, they still run into one more problem: proving the platform caused the result.
Attribution and Realization Are Hard to Prove
Attribution gets messy because several things change at once. Market conditions shift. Internal processes change. Team output changes too. So when results improve, pinning that lift on one platform isn’t simple. That’s why 67% of CPOs identify difficulty proving attribution as the primary barrier to technology adoption.
Then comes the realization gap. Many ROI models count savings when a contract is signed, but finance records them only when invoices are paid. That gap between forecasted and realized savings usually lands at 30–60% for organizations without automated tracking.
The fix is pretty straightforward: use a finance-approved realized-savings rule and track it at the invoice level. Without that, the ROI model is built on estimates instead of money that actually showed up.
Is Your Procurement Data AI-Ready? The Unvarnished Truth
The Metrics and Data Model Needed for Reliable ROI Tracking
The problems above - fragmented baselines, missed soft gains, and weak attribution - come back to one issue: teams aren't measuring the metrics that matter. If finance can't tie a metric to dollars, it won't trust the ROI story. So the fix starts with two things: pick metrics that map to dollar impact, and connect each one to a source the team can trust.
Financial, Efficiency, and Compliance Metrics
Start with financial metrics that link straight to spend. Realized savings in USD is the clearest one. It measures direct spend reduction after platform costs, which makes it the strongest input for ROI. Then add cost avoidance, which covers prevented costs like contract overruns caught early or auto-renewal penalties that never hit the books. Total cost of ownership (TCO) reduction adds a broader view of what changed over time. Put together, these metrics show both saved cost and avoided cost.
Efficiency metrics show where day-to-day work gets lighter. Requisition-to-PO cycle time helps show whether work is moving faster. Time saved per sourcing event shows where AI cuts manual steps and frees up team time.
Compliance metrics help connect ROI to risk control. On-contract spend rate and maverick spend reduction are strong signals here. Coca-Cola Europacific Partners cut maverick spend by 30% after deploying AI across 28 countries, contributing to $40 million in annual savings. Compliance incident counts pulled from audit logs give leadership a quarterly view of risk. These operating metrics help answer a simple question: are the savings real, repeatable, and tied to the system?
Adoption and Data Quality Metrics
Adoption and data quality metrics show whether ROI can be tracked over time or if the whole model starts to wobble.
AI feature adoption rate shows the share of requests going through the AI system instead of email or spreadsheets. That matters because bypassed workflows create blind spots. The share of items reviewed with automated compliance scoring shows whether use is steady across teams or limited to a few pockets.
Data quality is where many ROI models live or die. High-quality, governed data is the biggest driver of AI ROI. Spend data needs at least 85% classification accuracy before ROI becomes reliable. The percentage of POs linked to contracts is a practical way to check data completeness, and it also improves attribution accuracy.
ROI Metric Reference Table
The table below separates hard savings, efficiency, adoption, and data-quality signals.
KPI | ROI Impact Type | Data Source | Reporting Frequency |
|---|---|---|---|
Realized Savings (USD) | Hard Savings | ERP / Spend Analytics | Quarterly |
Cost Avoidance (USD) | Cost Avoidance | Contract Audit Logs | Quarterly |
TCO Reduction (%) | Hard Savings | ERP / Supplier Data | Quarterly |
Requisition-to-PO Cycle Time | Efficiency | Workflow Logs | Monthly |
Time Saved per Sourcing Event | Efficiency | Sourcing Platform | Per Event |
Maverick Spend Reduction (%) | Hard Savings | ERP / PO Logs | Monthly |
On-Contract Spend Rate (%) | Compliance | Contract Management | Quarterly |
Compliance Incident Count | Risk Reduction | Audit Logs / GRC System | Quarterly |
AI Feature Adoption Rate (%) | Adoption | Platform Usage Logs | Monthly |
% Sourcing Events Using AI Specs | Adoption | AI Platform Analytics | Monthly |
% Items with Compliance Scoring | Adoption | AI Platform Analytics | Monthly |
Spend Classification Accuracy (%) | Data Quality | Spend Analytics Tool | Monthly |
% POs Linked to Contracts | Data Quality | ERP / CLM Integration | Monthly |
Some signals show up early. Cycle time gains usually appear within 30 to 60 days. Realized savings and compliance gains need 3 to 6 months of volume before the numbers are stable enough to trust. These metrics set the baseline for initiative-level tracking in the next step.
A Practical Framework for Fixing ROI Tracking
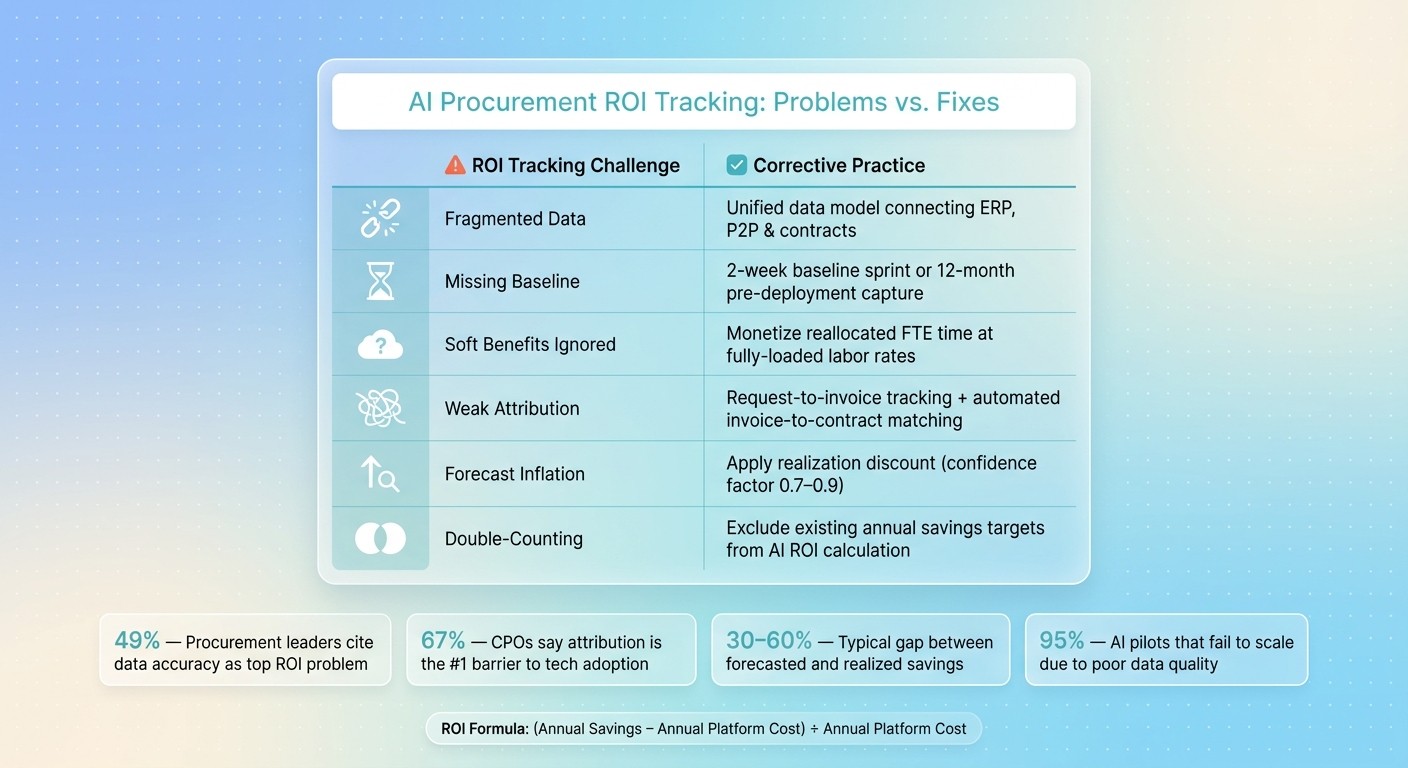
AI Procurement ROI Tracking: Key Metrics, Problems & Fixes
Turn those metrics into one finance-ready ROI model. The shift is pretty simple in theory: stop relying on ad hoc reporting and move to a set process with one formula, a documented baseline, and a clear path from sourcing activity to realized savings.
Build a Standard ROI Formula and a 12-Month Baseline
The simplest defensible formula is: ROI = (Annual Savings − Annual Platform Cost) ÷ Annual Platform Cost. To make that number hold up under scrutiny, use full TCO: software, implementation, data prep, change management, and internal labor.
On the baseline side, use 12 months of clean historical data whenever you can. That gives you a normal pre-AI performance picture instead of a cherry-picked snapshot. If that history isn't available, run a 2-week baseline sprint and log current task time, pain points, and exceptions.
For savings, don't treat first-year projections as if every dollar will land exactly as planned. Apply a confidence factor of 0.7 to 0.9 to hard savings projections. Then report a range instead of a single number, like $3.0M to $5.5M at 80% confidence. That gives finance a view that's easier to trust.
Just as important, every savings claim should trace back to a source record.
Track Value from Initiative to Realized Savings
Track savings all the way from commitment to payment. In practice, that means linking specs, sourcing, contracts, and invoices in one traceable workflow so teams can catch overbilling and duplicate payments before payment.
Attribution also needs discipline. Savings should be net of AI platform costs, and they should not include value already committed in the team's annual targets. If you count those dollars twice, the ROI story falls apart fast.
It also helps to assign one person to own outcome tracking. When one person is accountable, anomalies are more likely to get flagged before they turn into a credibility problem.
Use the table below to connect each tracking issue to the right fix.
ROI Tracking Problem-to-Solution Comparison Table
ROI Tracking Challenge | Corrective Practice | Metrics Affected | Expected Improvement |
|---|---|---|---|
Fragmented Data | Unified data model/orchestration connecting ERP, P2P, and contracts | Data Accuracy, Reporting Maturity | More reliable reporting |
Missing Baseline | 2-week baseline sprint or 12-month pre-deployment capture | Cycle Time, Cost per PO | Defensible "before" state for % improvement claims |
Soft Benefits Ignored | Monetize reallocated FTE time at actual fully-loaded labor rates | FTE Capacity, Cost per Contract | 2–3x capacity per FTE |
Weak Attribution | Request-to-invoice tracking; automated invoice-to-contract matching | Realized vs. Negotiated Savings | 40–60% reduction in savings leakage |
Forecast Inflation | Apply a realization discount | Reported ROI | Aligns with CFO expectations |
Double-Counting | Exclude existing annual savings targets from AI ROI calculation | Net Annual Value | Ensures AI value is incremental, not redundant |
How AI Capabilities Improve ROI Visibility
Specification Creation, Product Discovery, and Compliance Scoring as Measurable ROI Drivers
Those metrics only hold up if AI records them inside the workflow. That’s the key. The three main functions of an AI procurement platform - specification creation, product discovery, and compliance scoring - each produce outputs you can track and tie back to the ROI model defined earlier.
Specification creation cuts down the manual back-and-forth between procurement teams and requesters. When intake is standardized with AI, teams can track hours saved per specification and turn that into labor cost. AI-powered specification extraction can reduce manual effort by 85–95%, which gives finance a direct labor-savings figure.
Product discovery makes hard savings much easier to prove. AI can spot duplicate subscriptions, underused licenses, and pricing gaps. That creates clear USD savings tied to lower-cost options or vendor consolidation.
Compliance scoring turns policy adherence into something you can measure. Build policy checks into the workflow, then track how many requests get approved only after passing security and budget controls. From there, you can estimate avoided risk. Non-compliant "maverick" purchases typically cost 15–20% more than contracted rates, so even small gains in compliance can lead to defensible USD savings.
AI Feature-to-ROI Benefit Mapping Table
Use this mapping to connect each platform function to one ROI metric and one reporting source.
AI Capability | Measurable Outcome | ROI Metric | How to Express Results |
|---|---|---|---|
Specification Creation | Reduced rework; faster intake triage | Cycle time (Submission-to-PO) | % reduction; hours saved |
Product Discovery | Negotiated savings; vendor consolidation | Hard savings; spend under management | USD savings; ROI multiple |
Compliance Scoring | Risk mitigation; avoided audit fines | Policy violation rate; audit trail defensibility | % compliance; risk $ avoided |
Invoice Matching | Caught overbilling; captured discounts | Error rate; early payment discount rate | USD recovered; payback period |
Workflow Automation | Strategic capacity recovery | FTE hours reallocated to sourcing | % team time recovered |
Conclusion: What Procurement Teams Should Measure First
Start with one rule: define AI procurement cost-benefit insights before deployment. Fix data quality issues and baseline gaps first. 95% of AI procurement pilots fail to scale largely because of poor data quality and unclear success metrics.
Next, separate forecasted savings from realized savings. The cleanest way to do that is to match invoices against contract terms in real time. Soft benefits matter too, but they need to be translated into labor-cost equivalents so finance can treat them as more than nice-to-have efficiency gains.
AI usage data and compliance scores act as attribution evidence. If you track them from day one and keep that tracking consistent, your ROI case gets stronger over time. Start with a baseline, split hard savings from soft benefits, and measure realized savings against invoices.
FAQs
What counts as realized savings?
Realized savings are the spend cuts that actually show up on the profit and loss statement, not just ideas or projected opportunities.
That’s the key difference from identified savings. Identified savings may look good on paper, but they don’t always reach the bottom line.
If procurement teams want savings figures that finance leaders will stand behind, they need to focus on hard savings. It also helps to apply a realization haircut, because the value that lands in the business is often lower than the first projection.
How do I prove the AI platform caused the savings?
Create a clear, auditable link between AI-driven decisions and financial results. Procright does this by recording the reasoning behind each decision early in the buying cycle.
Because it reviews specifications and ranks products with transparent citations, you get a clear record of why a product was picked and how it met the requirements. That makes savings much easier to defend with auditors and internal stakeholders.
What should I track before rollout?
Establish a baseline before rollout. Track current sourcing cycle times, spend, and how much time teams spend manually searching for suppliers or drafting specifications.
Without historical data, you can’t clearly measure ROI. Procright helps capture this by standardizing requirements and compliance scoring before purchase. That makes it easier to show faster decision-making and lower financial risk from incorrect product choices.
Related Blog Posts
Try it on a real buy
Bring one category. Watch where the flags land.
We use a little analytics to see which pages actually help. Nothing else, no ad trackers.