Supply Chain Forecasting: Practical Methods for 2026
Forecast quality matters, but process design, sensing, and stakeholder mechanics decide whether the forecast turns into action or just another slide deck.
In this article
You're in the meeting again. The planner has a clean baseline, sales pushes back on a chunk of SKUs, finance questions the safety stock math, and nobody leaves with a number they'll commit to. That's the supply chain forecasting problem in many teams, the model didn't fail because the math was weak, it failed because the operating cadence around it was weak.
Good supply chain forecasting is a recurring decision process, not a one-time build. The teams that get value out of it define refresh timing, set exception rules, and make overrides defensible before anyone starts arguing about the output. For a useful outside perspective on why prediction alone doesn't solve planning, perché predire il futuro non basta is a solid read, and the data-consolidation side of the problem is just as important when signals live in different systems, as discussed in cross-source data consolidation challenges.
The point is simple. Forecast quality matters, but process design, sensing, and stakeholder mechanics decide whether the forecast turns into replenishment action or just another slide deck.
The Forecasting Problem Most Teams Keep Getting Wrong
A quarterly demand review often starts with confidence and ends with compromise. The planner presents a statistical baseline, sales overrides a long list of SKUs based on channel chatter, finance pushes back on the safety stock math, and the room runs out of time before anyone signs off on a number. What looked like a forecasting meeting was really a governance problem.
The model is only the start
A forecast in a spreadsheet or model isn't the answer. It isn't. A forecast only becomes operationally useful when people agree on refresh cadence, override rules, and what happens when the number changes after the plan has already moved into procurement or production.
That matters because baseline forecast quality hasn't magically healed over time. A major benchmark study found forecastability stayed around 66% plus or minus 2%, while forecast error averaged 48% plus or minus 1% over five years, which shows how stubborn the problem remains at scale. The benchmark white paper is useful here because it reminds teams that the constraint is persistent, not occasional.
Accuracy is not the same as value
Teams also conflate accuracy with business value. A forecast can look numerically tight and still be useless if it misses the items that drive shortages, overtime, or expediting. In durable consumer products, the Institute for Supply Management reported a demand forecast error benchmark of about 50 percent in 2024, which is high enough to distort procurement and inventory decisions in a meaningful way. ISM's monthly metric note makes that trade-off hard to ignore.
Practical rule: if the forecast can't survive review by sales, finance, and procurement, it isn't a committed plan yet.
The same logic shows up when teams depend on disconnected source systems. If shipments, orders, and assumptions live in different places, the forecast becomes a reconciliation exercise instead of a planning tool. Procright's write-up on cross-source data consolidation challenges reflects that exact pain point in operational terms.
Inputs That Actually Move Your Forecast
The best forecasts start with the signals that move demand, then strip out the ones that only create noise. In practice, that means the planner has to rank inputs by trust, not by convenience. Historical transactions matter, but not every transaction matters equally.
Start with the transaction trail
The first pass should usually include shipments, orders, returns, and billings. When those signals diverge, the right choice depends on what you're trying to predict. Shipments can understate true demand during stockouts, orders can overstate demand when customers pull forward, and billings can lag the physical flow enough to distort short-term planning.
That's why historical data can't just be dumped into a model untouched. If a SKU was out of stock, last period's low shipment number is not a clean demand signal. If a launch is new, you don't have a stable pattern yet, so the history needs judgment, not blind weighting.
Layer in the drivers that change the curve
After the transaction trail, add the drivers that move demand around the curve. Pricing, promotions, holidays, weather, and lifecycle stage often explain the spikes and dips that raw history can't. They matter because planners don't forecast isolated lines, they forecast a demand environment.
For volatile categories, the historical-versus-forward-looking split becomes more important than the model family. A product exposed to promotions or channel shifts may need recent history weighted more heavily in some windows and ignored in others, especially when an outlier period reflects a stockout or a one-time event. The discipline is to ask whether the past period was representative before feeding it downstream.
Bring in forward-looking inputs early
Forward-looking signals should enter before the forecast gets frozen. Sales pipeline, customer commitments, and macro indicators can all reshape the next cycle, but only if someone owns them and updates them on time. If the operating team waits until the monthly review to correct those inputs, the forecast is already stale by the time procurement sees it.
Operational note: when stockouts or launches distort the record, label them explicitly instead of smoothing them away. Hidden exceptions become bad training data.
The planning detail matters too. Teams that are trying to align demand with replenishment often need a clean view of timing, so a lead time calculator becomes part of the input discipline, not a separate admin task.
Choosing the Right Model Family for Your Data
Model choice should follow the SKU profile, not the other way around. A stable, high-volume item does not need the same machinery as an intermittent spare part or a promotion-heavy consumer SKU. The wrong model family usually fails by being too complex for the signal, or too simple for the volatility.
The workhorses still earn their keep
For stable items, moving averages and simple exponential smoothing are still practical baseline tools. They're easy to explain, quick to maintain, and good enough when demand doesn't swing wildly. They also give planners a clean reference point, which matters because a complicated model that nobody trusts is often worse than a simpler one that's used consistently.
For series with visible trend or seasonality, Holt-Winters and ARIMA-style methods are the next step up. They handle recurring patterns better than a flat average, especially when the item has a repeatable sales rhythm. The key limitation is that they still depend on history that behaves like history.
Where ML helps, and where it doesn't
Machine learning ensembles and AI-assisted hybrids, including gradient boosting and transformer-style approaches, can outperform traditional methods when the team has enough feature depth and clean event data. They need real input discipline, though. Without rich history, good product hierarchies, and reliable causal features, they can look impressive in testing and disappoint in live planning.
That's why the question is less “what's the most advanced model?” and more “what kind of series am I forecasting?” Intermittent demand, short lead times, heavy promotion cycles, and frequent assortment changes all push you toward different trade-offs. A model that works beautifully for a smooth replenishment item can fail badly on a long-tail SKU with sparse demand.
Forecast Model Family Comparison by SKU Profile | Best Fit SKU Profile | Strengths | Failure Modes | Minimum Data Need |
|---|---|---|---|---|
Moving Average | Stable, high-volume SKUs | Simple, transparent, easy to maintain | Lags when trend changes | A short, clean history |
Simple Exponential Smoothing | Stable SKUs with mild noise | Responsive to recent changes | Weak on seasonality | A consistent historical series |
Holt-Winters | Seasonal or trending SKUs | Captures trend and seasonality | Can overreact to shocks | Enough cycles to show pattern |
ARIMA-Style Methods | Structured series with repeatable behavior | Strong baseline for time-series patterns | Harder to tune and explain | Sufficient uninterrupted history |
ML Ensembles | Complex SKUs with many drivers | Handles nonlinear relationships | Needs feature quality and monitoring | Rich history plus causal inputs |
AI-Assisted Hybrids | Multi-driver, dynamic categories | Can combine signals and context | Governance and explainability gaps | Broad, well-governed data |
A useful rule of thumb is this. If the item is intermittent, volatility is high, or the lead time is long relative to the selling pattern, start with the simplest model that the team can explain, then add structure only where it changes the decision.
Measuring Forecast Accuracy the Right Way
Forecast QA should be done the same way every cycle. Set the forecast level, such as SKU-location-week, define the horizon, then compare the frozen forecast to the version that was committed. If the team keeps changing the yardstick, the numbers will never settle into a meaningful operating rhythm.
Pick the metric based on the question
The practical workflow is to calculate WAPE, MAPE, MAE, RMSE, bias, and tracking signal after each cycle, but not to treat them as interchangeable. AWS's supply chain guidance lays out that sequence well, starting with forecast level and horizon, then extracting forecast versions, then aggregating the errors with the right metric for the right situation. AWS prescriptive guidance is especially useful because it warns that MAPE can mislead on low-volume SKUs, while WAPE is usually more effective for small-volume items.
That distinction matters in mixed portfolios. WAPE gives a better aggregate view when item volumes vary widely, while MAPE can make a tiny series look worse than it is. MAE and RMSE help when you need to see how hard the misses are, and bias tells you whether the plan is systematically too high or too low.
Match the metric to the SKU profile
A planner doesn't need every metric on every line. Smooth runners usually need more attention on RMSE and bias, because the issue is often the size and direction of the miss. Intermittent items benefit more from WAPE and bias. Promotional SKUs need post-event lift analysis, because headline MAPE alone won't tell you whether the forecast missed the promotion curve or just the baseline.
For a more metric-focused discussion, the PlostStudio AI forecasting tips page is a helpful practical reference, especially when teams want to explain why one metric can be misleading while another is more operationally useful.
Keep the control signals visible
Bias and tracking signal are the parts many teams skip. That's a mistake, because a model can look acceptable on average while drifting badly in one direction. Tracking signal is especially useful when you want an early warning that the forecast has moved outside a range the planners can still defend.
Forecast Accuracy Metrics by SKU Profile | Primary Metric | Secondary Metric | Watch-out |
|---|---|---|---|
Smooth runners | RMSE | Bias | Large misses can hide behind averages |
Intermittent items | WAPE | Bias | MAPE can blow up on tiny volumes |
Promotional SKUs | WAPE | Post-event analysis | Headline accuracy can miss event timing |
Mixed portfolios | WAPE | Tracking signal | Aggregates can hide category drift |
Why Better Models Alone Won't Close the Error Gap
The gap is still wide even where teams have decent planning maturity. In durable consumer products, ISM's 2024 benchmark of about 50 percent forecast error shows that a model swap doesn't magically solve the problem when the operating environment is volatile. In other benchmark reporting, item-level error has also remained stubbornly high over time, which is why algorithm changes often deliver diminishing returns once a baseline exists.

The real drag is usually process design
A lot of forecast miss comes from cadence, not code. If the team refreshes too slowly, exception handling becomes reactive. If demand sensing is weak, the baseline never sees the latest POS or sell-through pattern in time. If the forecast isn't tied cleanly to replenishment, planners keep arguing about the number instead of acting on it.
That's why new product launches, cannibalization, and post-promotion decay are so hard. The history either doesn't exist, or it no longer describes the current demand shape. Even models can stumble when the input signal is lagged, sparse, or politically smoothed before it reaches planning.
Better sensing beats fancier math at the margin
The most useful improvement often comes from tightening the loop between signal and action. Category-specific review cadence, exception thresholds, and clear ownership do more for operational usefulness than another model feature does. In a real planning team, that means deciding which changes deserve an immediate review, which ones wait for the next cycle, and which ones are noise.
When the underlying demand pattern is changing faster than the plan cycle, the forecast process has to adapt first.
That's the practical takeaway. Invest the next dollar in better sensing, cleaner exception governance, and faster handoffs into replenishment. The model still matters, but it stops being the bottleneck once the process can absorb what the model sees.
Scenario Planning and Procurement Implications
A forecast is only useful if procurement can turn it into an action before the market changes again. That means using structured scenario planning, not loose percent swings that look analytical but don't connect to supplier decisions. Baseline, best case, and worst case should each tie back to a driver the team can name.
Build the scenarios around real risks
Start with the baseline demand forecast, then layer scenarios on top of it using lead time variance, supplier disruption risk, and demand-driver changes. A geopolitical event, port congestion, or a capacity constraint changes procurement behavior differently than a short-term price change, so the scenario logic needs to preserve that difference. If the scenario doesn't alter purchasing timing or inventory posture, it isn't useful.
The planning output should also create a clean audit trail. Each override needs a documented assumption, a versioned baseline, and a named approver. That record matters when finance challenges the number or a supplier disputes the expectation later.
Treat overrides like decisions, not edits
Most conflict happens because overrides are made casually and defended poorly. The cleanest workflow is to tie each edit to a signal, such as a POS shift, an out-of-stock event, or a price action, then store the reason beside the forecast version. That makes the forecast reviewable by finance, sales, and procurement without relying on memory.
One practical option for teams that need audit-ready sourcing records alongside forecast-driven buying decisions is Procright, which creates a traceable decision record across specification, supplier discovery, and evidence-backed comparisons. It's not a forecasting engine, but it fits well when forecast decisions lead directly into supplier selection or re-tendering work.
Feed the scenarios into purchasing moves
The output should inform PO timing, safety stock re-parameterization, and supplier negotiation talking points. If the worst case suggests a slower recovery window, procurement can pre-position alternates before the demand shock lands. If the base case holds, the team can avoid overbuying into a temporary spike.
The best teams don't treat scenario planning as theater. They use it to decide what to buy, when to buy it, and what evidence will support that choice if somebody questions it later.
A 90-Day Plan to Improve Forecasting in Practice
A 90-day reset works best when it's concrete enough for a category manager to run without outside help. The aim isn't perfection. It's a forecast process that people can trust, review, and defend on schedule.
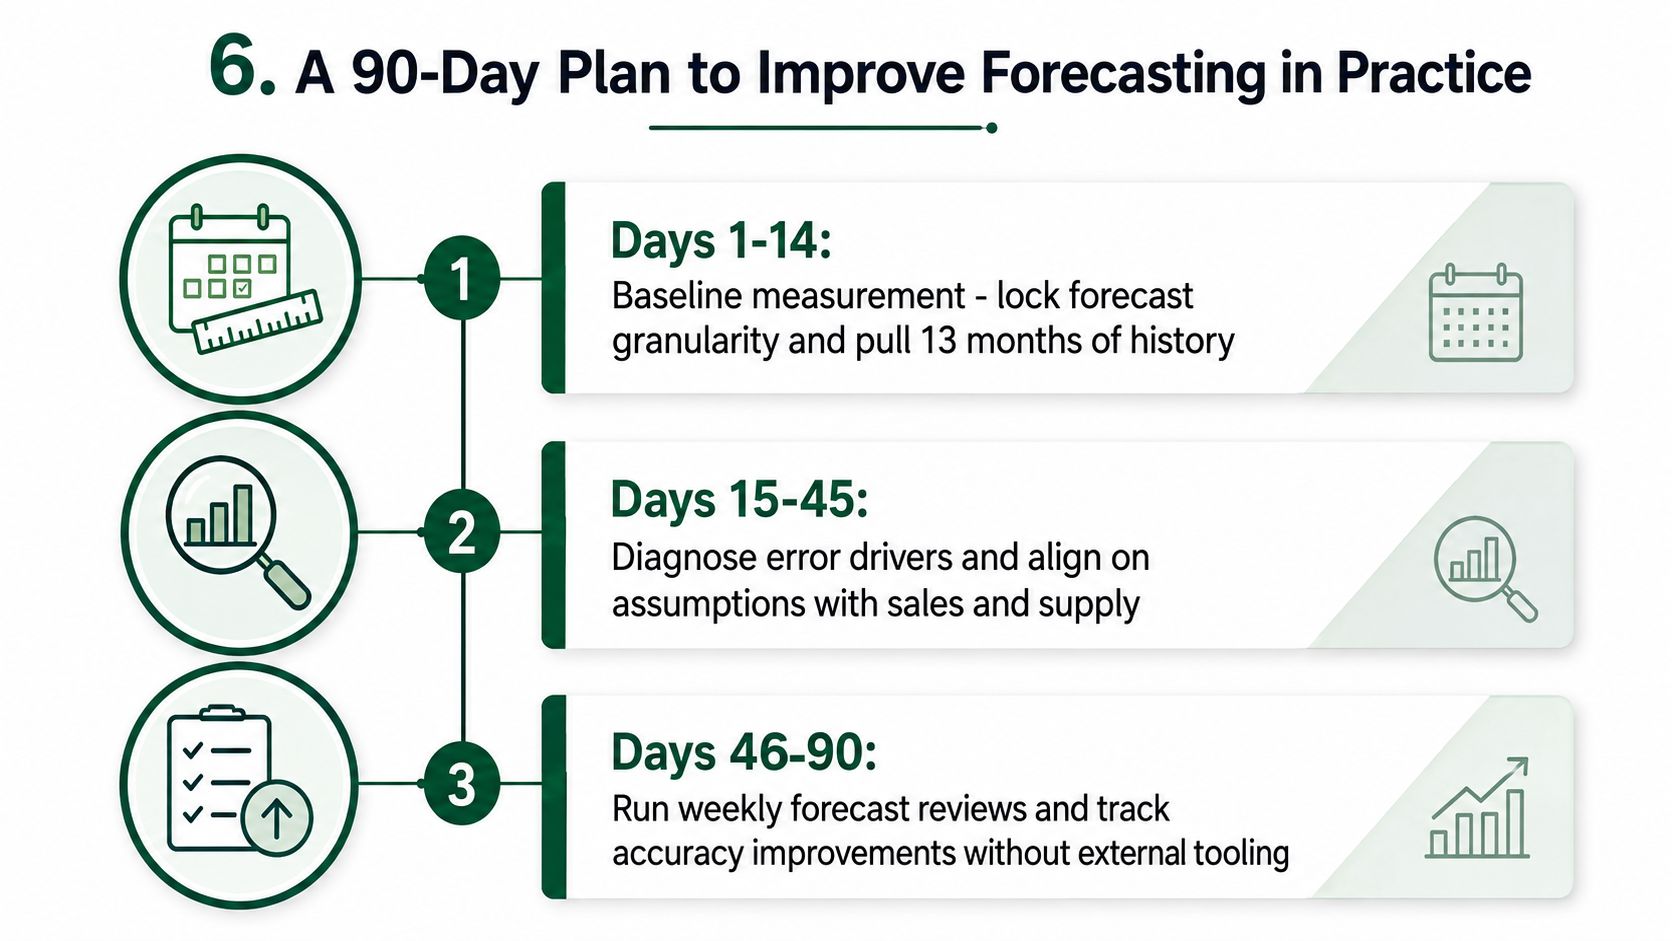
Days 1 through 14
Lock the forecast granularity first, then pull enough history to establish a clean baseline. Compute starting WAPE and bias by SKU segment, and keep the versions frozen so you can tell what changed and when. If the inputs are messy, note that before anyone starts arguing about the model.
Days 15 through 45
Clean up the data flow. Reconcile point-of-sale, sell-in, and shipment data, then document every override and the reason behind it. If procurement and planning use different assumptions, the forecast won't hold up under review.
Days 46 through 90
Run a segment-by-segment model fit review, define exception thresholds, and do a scenario-planning dry run with two named suppliers. In the final two weeks, move the work into cadence, weekly forecast review, monthly bias audit, and a quarterly stakeholder pack with the override log.
The procurement-side questions usually come up fast. If contract minimum order quantities limit flexibility, record that as a scenario constraint. If supplier lead time is volatile, fold it into the scenario assumptions instead of pretending it's fixed. When an override is contested, escalate with the versioned baseline, the signal that triggered the change, and the approver trail.
For a practical change-management angle on the first three months of procurement work, the procurement-first 90 days success guide is worth keeping nearby.
By day 90, a disciplined team should see a clearer bias pattern, cleaner exception handling, and a forecast that is easier to defend in review. That's the point, not a vanity accuracy number. It's a forecast process that procurement, finance, and sales can work with.
If you're tightening forecasting across planning, procurement, and supplier review, Procright can help you keep the record defensible when decisions start affecting sourcing. Visit Procright to see how audit-ready evidence, structured comparisons, and traceable workflows fit into the same operational rhythm as your forecast reviews.
Try it on a real buy
Bring one category. Watch where the flags land.
We use a little analytics to see which pages actually help. Nothing else, no ad trackers.