How Predictive Analytics Improves Supplier Reliability
Predictive analytics turns supplier data into early risk signals that prevent disruptions and cut emergency procurement costs.
Predictive analytics helps procurement teams anticipate supplier performance by analyzing historical data and identifying potential risks before they escalate. By focusing on key metrics like delivery reliability, defect rates, and financial health, companies can make informed decisions to reduce supply chain disruptions and costs. Here's what you need to know:
Why It Matters: Supplier issues can lead to production delays, missed deadlines, and unplanned cost increases of 15–30%. Predictive strategies lower this to 10–25%.
Key Data Signals: Internal metrics like on-time delivery and defect rates, combined with external factors like geopolitical risks and market trends, create accurate forecasts.
Steps to Implement:
Integrate and clean supplier data from systems like POs, AP records, and QA logs.
Define metrics such as OTIF (On-Time In-Full) and defect rates.
Use models (time-series, regression, classification) to predict risks and adjust procurement strategies.
Results: Companies using predictive analytics report 20–40% lower emergency procurement costs and faster responses to disruptions.
Predictive analytics isn’t just about data - it’s about turning insights into actions that improve supplier reliability and strengthen procurement processes.
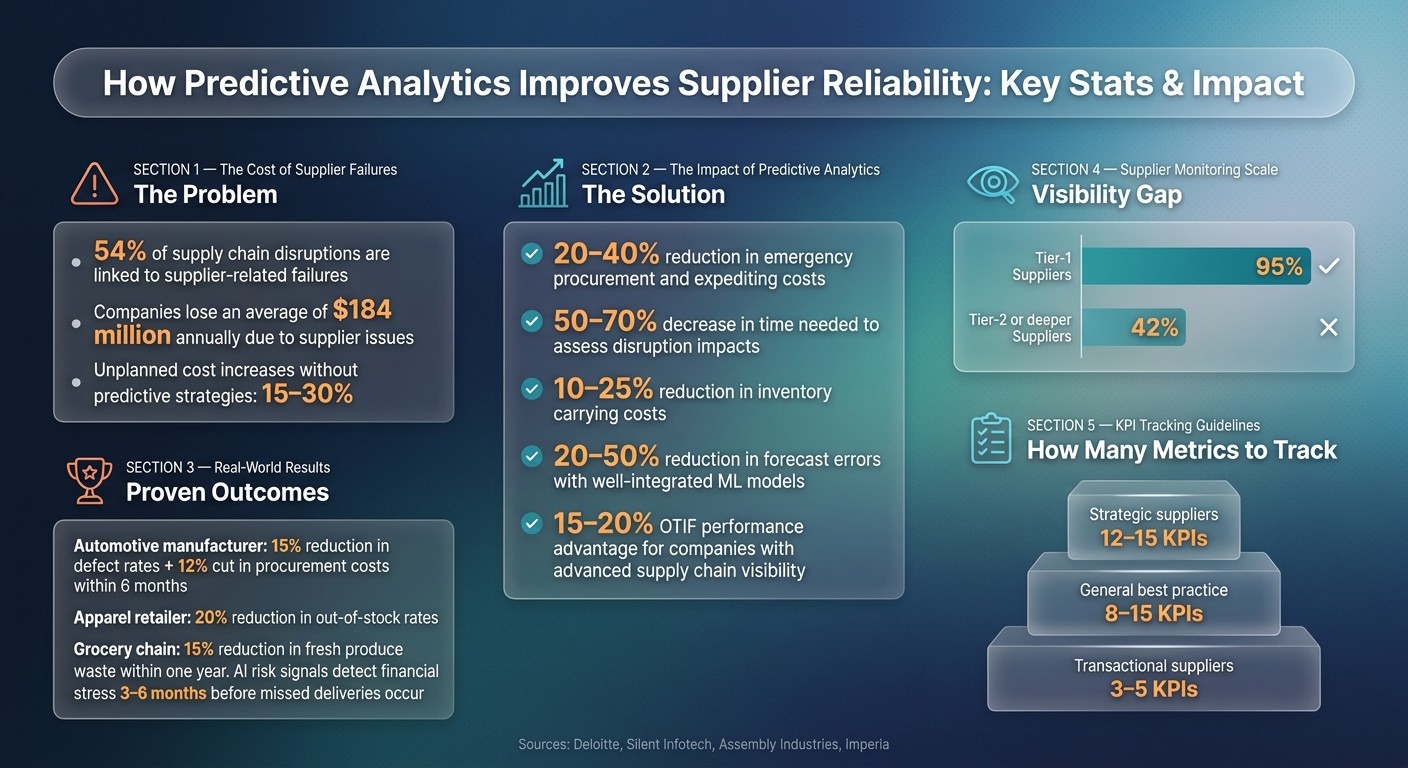
Predictive Analytics in Procurement: Key Stats & Business Impact
Building a Data Foundation for Supplier Analytics
Mapping and Integrating Supplier Data Sources
To effectively analyze supplier reliability, start by identifying and integrating critical data sources. Most procurement teams rely on at least four key systems: purchase orders (POs), accounts payable (AP) records, advance ship notices (ASNs), and quality assurance (QA) logs. Each of these systems brings unique insights into supplier performance.
The PO serves as the foundation for supplier data. As Michael Ciavarella, Director of Operations, explains:
"Purchase order data captures every essential dimension of a supplier relationship: what was ordered, when, under what terms, and from whom."
The PO number and line item act as the central key that connects data across ERP, AP, and logistics systems. This common thread ensures that data from various sources aligns seamlessly.
To enrich your internal data, consider incorporating external feeds like financial APIs or news updates. Companies with advanced supply chain visibility outperform competitors by 15% to 20% on OTIF metrics, giving them a clear edge.
Once your data sources are integrated, the next step is ensuring their accuracy and consistency.
Data Cleaning and Normalization
After gathering and mapping data, standardization is crucial. Supplier data often suffers from inconsistencies - supplier names might differ across systems, date formats vary, and currencies may not align. To address this, convert everything into a uniform format: dates in MM/DD/YYYY, currency in USD, and consistent measurement units.
AI tools for data validation can speed up this process, helping to clean and standardize data. These tools can identify duplicate supplier entries, correct inconsistent naming, and use historical patterns to fill in missing information through a method called data imputation. Deloitte emphasizes this point:
"AI-based intelligent analytics can provide meaningful inputs for key decisions only if the underlying data is accurate and comprehensive."
Skipping this step can undermine the accuracy of predictive models, making clean data an essential foundation.
Defining Supplier Reliability Metrics
With integrated and cleaned data, the next step is to establish the metrics for evaluating supplier performance. One of the most widely used measures is On-Time In-Full (OTIF). A delivery is only considered successful if it arrives on time and fulfills the entire order quantity. For instance, Walmart enforces a 98% OTIF requirement and imposes a 3% penalty on the cost of goods sold for non-compliance.
Beyond OTIF, there are additional KPIs that are central to assessing supplier reliability:
Metric | What It Measures | Formula |
|---|---|---|
OTIF % | On-time and complete deliveries | (On-Time & In-Full POs ÷ Total POs) × 100 |
Defect Rate | Product quality failures | (Defective Units ÷ Total Units) × 1,000,000 (PPM) |
Lead Time Variance | Deviation from quoted lead time | Actual Lead Time − Quoted Lead Time |
Fill Rate | Order quantity fulfilled | (Delivered Units ÷ Ordered Units) × 100 |
The number of metrics you track should depend on the supplier's importance. For strategic suppliers, monitoring 12–15 KPIs might be necessary, while transactional suppliers may only require 3–5. Overall, keeping track of 8–15 metrics strikes a good balance between focus and visibility.
One critical detail: make sure your organization defines "on-time" consistently - whether it’s based on the requested date or the promised date - before evaluating supplier performance. These metrics will then serve as the foundation for predictive models that can forecast supplier reliability.
Developing Predictive Models for Supplier Reliability
Setting Clear Objectives for Predictive Models
Before diving into model development, it’s critical to set clear, actionable goals. Vague objectives won’t get you far. Instead, ask targeted questions: How far in advance do you need to identify potential delivery delays? What specific OTIF (On-Time, In-Full) thresholds should trigger alerts? Which suppliers are so critical that their failure could halt your production line?
Start by focusing on your highest-risk suppliers - those whose disruptions would have the most significant impact on your operations. Once you’ve validated the model for these key players, you can expand it to include lower-priority suppliers without introducing unnecessary noise.
"The real question is... whether you have the visibility to see [risk] before it disrupts your operations - or whether you're perpetually in reaction mode." - Silent Infotech
Define how you’ll measure success right from the beginning. Useful benchmarks might include cutting emergency procurement costs, improving response times to disruptions, or reducing safety stock levels. For example, companies leveraging AI-driven predictive analytics have reported a 20–40% decrease in emergency procurement and expediting costs. This kind of result can serve as a concrete target for your efforts.
Once your objectives are in place, the next step is identifying the data features that influence supplier reliability the most.
Feature Engineering for Supplier Reliability Models
With clear objectives in mind, it’s time to zero in on the features that will drive your model. These features are the backbone of prediction accuracy. Start with internal performance data, such as OTIF rates, historical lead times, defect rates, and payment records. But don’t stop there - incorporate external signals for a more comprehensive view. The table below highlights key risk categories and their corresponding data features:
Risk Category | Key Data Features |
|---|---|
Financial | Credit rating downgrades, cash-flow instability, insolvency filings |
Operational | Lead time variability, capacity constraints, quality incidents |
Compliance/ESG | Certification expiry, labor dispute news, regulatory filing changes |
Geopolitical | Trade tariffs, sanctions, regional political instability |
Concentration | Single-source dependencies, geographic clustering of sub-tier suppliers |
Market/Price | Commodity volatility, currency shifts, inflation trends |
Focus on variability, not just averages. For instance, instead of tracking only the average lead time, create a feature that measures variability over a rolling 60- or 90-day period. A supplier with lead times swinging from ±1 day to ±5 days may be signaling operational instability, even if their average performance looks fine.
"A steady increase in small delays (1–2 days) can be more dangerous than a one-time large delay because it often signals process degradation." - Imperia
Another critical factor is sub-tier visibility. While most organizations (95%) can monitor Tier-1 suppliers, only 42% have insight into Tier-2 or deeper. Mapping these hidden dependencies can uncover vulnerabilities, like multiple Tier-1 suppliers relying on the same critical component from a single upstream manufacturer.
Choosing the Right Modeling Techniques
The type of model you choose depends on what you’re trying to predict. Here are three common approaches for supplier reliability:
Time-series models (e.g., ARIMA, Prophet): Best for forecasting trends over time, such as changes in lead times, demand fluctuations, or seasonal delivery patterns. These models are ideal when timing matters as much as the event itself.
Regression models: Suitable for predicting numerical outcomes, like estimating how many days a shipment might be delayed based on a supplier’s recent performance and current logistics conditions.
Classification models (e.g., logistic regression, gradient boosting): Designed to predict binary outcomes, such as whether a supplier will miss their next delivery or whether they fall into a high-, medium-, or low-risk category. These models often provide a probability score to guide decision-making.
The real value comes from integrating these predictions into your procurement workflows. For example, use the outputs to trigger purchase order approvals, adjust inventory buffers, or flag a supplier for proactive discussions. Machine learning models that are well-integrated and continuously refined can reduce forecast errors by 20–50%, leading to a 10–25% reduction in inventory carrying costs.
"AI risk intelligence only creates business value when it drives action." - Silent Infotech
Putting Predictive Insights to Work in Procurement
Adding Predictive Scores to Supplier Evaluation
Once your predictive models start generating results, the challenge is turning those insights into actionable steps for procurement. Instead of relying on static scorecards, consider shifting to dynamic risk tiering. This means that if a supplier's predictive score changes - say, due to declining financial health or increased lead time variability - their risk tier adjusts automatically. This dynamic approach lets you fine-tune monitoring efforts and operational decisions in real time.
One way to implement this is by developing a "Future Performance Risk Score." This score combines leading indicators like debt-to-equity ratios, purchase order (PO) acknowledgment speeds, and exposure to commodity price fluctuations. Research indicates that when a supplier's financial health score drops by 10%, defect rates typically rise by 5% about six months later. This forward-looking signal gives procurement teams a critical edge, allowing them to intervene before problems escalate.
To ensure accuracy in supplier evaluations, particularly in regulated industries, use predictive scores as part of the decision-making process - but include human oversight where required. Start small: pilot your scoring model with your top 50 suppliers by spend. Compare the AI-generated scores with the judgments of experienced buyers to validate the model before scaling it across your supply chain.
For even greater impact, integrate these predictive scores with your inventory systems. This creates a seamless link between supplier evaluations and procurement actions.
Using Predictions to Guide Inventory and Planning
Dynamic risk scores can also revolutionize inventory management. By using predictive insights, you can adjust inventory buffers proactively to reduce the impact of supplier disruptions. Without this integration, teams often end up reacting to problems instead of preventing them.
One effective strategy is dynamic safety stock adjustment. For example, if a supplier's risk score hits a certain threshold, your ERP system (like SAP or Oracle) can automatically trigger actions such as additional approvals for purchase orders or increasing safety stock levels. Instead of scrambling to address missed deliveries, you're prepared in advance.
This approach has proven results. An apparel retailer cut out-of-stock rates by 20% using predictive demand and inventory models. Similarly, a national grocery chain reduced fresh produce waste by 15% within a year by applying predictive forecasting. Most procurement teams start seeing measurable benefits within 6 to 12 months of implementing these systems.
"Proactive intelligence now drives procurement decisions." - Silent Infotech
To make this work, set clear thresholds. For instance, a specific drop in a supplier's risk score or a sudden change in lead times could trigger actions like activating backup vendors, adjusting reorder points, or escalating the issue to planners.
Working with Suppliers Using Predictive Data
Predictive analytics doesn't just improve internal processes - it also strengthens relationships with suppliers. By shifting the focus from past performance to potential risks, you can engage suppliers in forward-looking conversations about how to tackle emerging challenges together.
AI-driven signals can identify issues like financial stress or operational problems 3 to 6 months before they lead to missed deliveries or quality defects. This early warning system gives you time to act. For example, if a model flags liquidity concerns for a critical supplier, you could offer accelerated payment terms or supply chain financing to help stabilize their operations before a crisis hits.
Here’s a quick look at how predictive triggers can guide supplier engagement:
Predictive Trigger | Collaboration Activity | Proactive Outcome |
|---|---|---|
Increase in minor nonconformances or documentation issues | Targeted audit | Prevents major defect spikes or recalls |
Declining cash flow or rising Days Payable Outstanding (DPO) | Financial stabilization discussion | Avoids supplier bankruptcy or sudden disruptions |
Surge in supplier order changes | Capacity planning review | Adjusts sourcing volumes to prevent production delays |
Missed OTIF thresholds or unusual trends | Corrective Action Request (CAR) | Accelerates fixes to prevent schedule slips |
For these discussions to be effective, transparency is key. Suppliers need to understand why they’ve been flagged. By clearly explaining the specific signals and their magnitude, you can build trust and shift the focus from compliance to continuous improvement.
"Sharing this methodology transforms scorecards into collaboration tools rather than compliance checklists." - Michael Ciavarella, Director of Operations, Leverage AI
Maintaining and Improving Supplier Reliability Analytics Over Time
Assigning Governance and Ownership Roles
Once predictive models are in place and insights are integrated into procurement, the challenge becomes maintaining their value over time. Predictive analytics only stays effective when someone is responsible for ensuring its accuracy and relevance. Without clear ownership, data quality can decline, models may become outdated, and the insights they generate could lose their impact.
A cross-functional approach works best for assigning ownership. For instance, Category Managers can oversee supplier reviews, Operations can handle delivery requirements, Quality can validate defect data, Accounts Payable can manage invoicing metrics, and Risk/Compliance can address gating issues. To keep this structure organized, create a shared KPI Dictionary. This document should clearly define how each metric is calculated, identify the authoritative data source, and specify how often the data refreshes. The frequency of reviews should depend on supplier criticality:
Strategic suppliers: Quarterly business reviews
Core suppliers: Monthly check-ins
Transactional suppliers: Automated alerts based on exceptions
Every review should conclude with an actionable plan that includes tasks, assigned owners, deadlines, and measurable outcomes.
One helpful principle comes from Umbrex: "If a KPI does not drive a decision or action, remove it.".
Measuring Business Impact
With governance in place, the next step is to measure how supplier analytics impact the business. A combination of lagging indicators (e.g., defect rates, late deliveries) and leading indicators (e.g., rising exception rates, missed PO acknowledgments) provides a well-rounded view. Lagging indicators show past performance, while leading indicators help identify potential issues early.
AI-driven predictive analytics can deliver measurable results. For example, companies using these tools have reported a 20–40% reduction in emergency procurement and expediting costs. Additionally, organizations leveraging AI for risk monitoring have seen a 50–70% decrease in the time needed to assess disruption impacts. In one case, an automotive manufacturer that implemented real-time supplier performance dashboards reduced defect rates by 15% and cut procurement costs by 12% within six months.
Metric Category | Key KPIs | Business Value |
|---|---|---|
Delivery | OTIF rate, lead-time adherence, order fill rate | Reduced production downtime and emergency freight |
Cost | Price variance, invoice accuracy, emergency freight costs | Prevention of overcharges and cost leakage |
Quality | Defect rate, return rate, first-time-right performance | Fewer recalls and corrective actions |
Risk | Compliance flags, audit findings, financial solvency scores | Avoidance of critical supply chain failures |
Using Feedback Loops to Refine Predictive Models
Measuring impact is only part of the equation. To ensure predictive models remain effective, continuous refinement is key. These tools are not "set it and forget it" solutions - they need regular updates based on how well predictions align with actual outcomes.
"AI supplier risk management improves with use." - Silent Infotech
For example, review whether flagged suppliers actually experienced disruptions and whether clean scores matched real-world performance. Human oversight plays a critical role here. Procurement experts can validate and refine alerts, helping retrain models and improve their contextual accuracy. The ideal setup combines automation for continuous monitoring and pattern detection with human judgment for high-stakes decisions.
Embedding feedback mechanisms directly into ERP or QMS dashboards ensures these insights fit seamlessly into existing workflows, rather than requiring a separate tool.
"The shift works best when AI handles continuous monitoring and pattern detection while human judgment governs the decisions that follow - orchestration matters as much as automation." - Assembly Industries
Supply Chain Analytics: Descriptive, Predictive & Prescriptive Applications
Conclusion: Using Predictive Analytics to Strengthen Procurement
Supplier failures are more frequent and costly than many realize. In fact, 54% of supply chain disruptions are linked to supplier-related failures, with companies losing an average of $184 million annually due to these issues. Clearly, a more proactive approach is needed.
Predictive analytics offers a way to detect risks early - like signs of financial instability or compliance concerns - before they turn into full-blown disruptions. Moving away from static scorecards to real-time, continuous risk scoring ensures decisions are based on up-to-date information, supporting the operational and strategic improvements discussed throughout this article.
"The integration of AI and predictive analytics into procurement is not simply an operational enhancement; it is a strategic enabler." - Bronson.AI
This approach doesn’t just sound good on paper - it delivers measurable results. Companies have reported lower emergency procurement costs and faster responses to potential disruptions. By automating tasks like specification creation, compliance checks, and product comparisons, tools such as Procright provide teams with transparent, data-driven insights. This allows procurement professionals to focus more on strategic sourcing rather than constantly putting out fires.
However, technology alone isn’t enough. To make predictive analytics truly effective, organizations need strong governance, clearly defined risk thresholds, and human oversight. When combined with disciplined management, predictive analytics enables procurement teams to stay ahead of disruptions and manage supplier risks strategically.
FAQs
What data do I need to start predicting supplier risk?
To anticipate supplier risk, it's crucial to gather and analyze key data points. This includes historical supplier performance, quality metrics, delivery records, and financial health. Additionally, examining operational data and considering external factors like market trends and geopolitical conditions can provide a more comprehensive view. These insights play a vital role in spotting potential risks and ensuring more dependable supplier relationships.
How far ahead can predictive analytics warn about supplier issues?
Predictive analytics has the power to flag supplier issues well before they escalate. These tools are designed to detect early warning signs, enabling teams to act ahead of time and sidestep potential disruptions. In fact, many of these alerts can appear months in advance, offering businesses a critical window to mitigate risks and ensure their suppliers remain dependable.
How do I turn supplier risk scores into procurement actions?
Transforming supplier risk scores into practical procurement actions starts with predictive analytics. This approach helps identify and address potential issues before they escalate. Here’s how you can make it work:
Leverage risk scoring models: Analyze supplier data systematically to uncover potential vulnerabilities.
Integrate AI tools: Combine internal data with external sources for real-time risk assessments, giving you a clearer picture of supplier stability.
Set thresholds and alerts: Establish criteria that trigger specific actions, such as conducting audits or switching suppliers when risks exceed acceptable levels.
By adopting these strategies, you can make proactive, data-informed decisions that enhance the reliability of your supply chain.